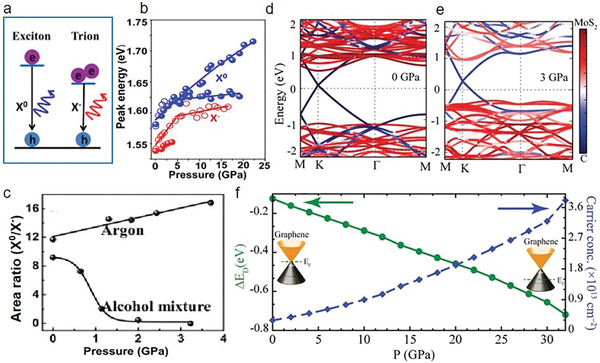
Figure 8.

Pressure‐induced doping. a–c) Schematic diagram of the transition process for neutral exciton (X0) and trions (X−) in 2H‐MoSe2 monolayer, peak position evolutions of X0 and X− versus pressure, and the PL intensity ratio of X0 to X− as a function of pressure, respectively.[ 46 ] d,e) Calculated electronic structure at ambient pressure and 3 GPa. f) The Dirac point (left axis) and the induced carrier density (right axis) of graphene from the heterostructure of graphene/MoS2 versus pressure. a–c) Reproduced with permission.[ 46 ] Copyright 2017, American Chemical Society. d–f) Reproduced with permission.[ 37 ] Copyright 2016, Wiley‐VCH.
