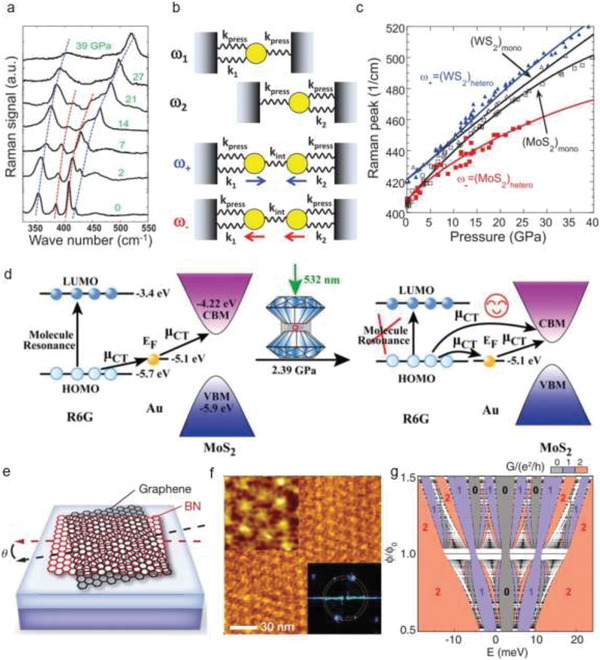
Figure 11.

Engineering vdW interactions. a) Pressure‐dependent Raman spectra of WS2/MoS2 bilayers (the dashed lines are for guiding the eyes). b) Schematic modeling two coupled harmonic oscillators, where ω± and k int represent the renormalized vibration frequencies and the enhanced coupling, respectively. The arrows reveal the vibration directions, which correspond to the optical‐like and acoustic‐like modes. c) The model fitting of A′1 modes in heterostructures [(WS2)hetero (blue) and (MoS2)hetero (red)]. (WS2)mono and (MoS2)mono stand for the A′1 modes of the individual TMDs. d) Surface‐enhanced Raman spectroscopy (SERS) charge transfer process in a system of MoS2/Au/R6G. e) Schematic of graphene stacking on h‐BN with an angle of θ, showing the occurrence of Moiré patterns. f) The measured Moiré patterns of graphene/h‐BN with a triangular lattice, where the upper inset demonstrates the enlarged image and the lower inset is a fast Fourier transfer of the measured regions, showing the Moiré wavelength of 15.5 ± 0.9 nm. g) Calculated Hofstadter energy spectrum of the full spin and sublattice‐spin N = 0 Landau level. The dense energy bands are described by the black points; the interval spectral gaps are coded with different color, which represents the corresponding two‐terminal conductance: 2 (red), 1 (purple), and 0 (gray). a–c) Reproduced with permission.[ 235 ] Copyright 2015, American Physical Society. d) Reproduced with permission.[ 45 ] Copyright 2015, Royal Society of Chemistry. e,f) Reproduced with permission.[ 258 ] Copyright 2015, Springer Nature. g) Reproduced with permission.[ 257 ] Copyright 2013, the American Association for the Advancement of Science.
