
Figure 2.
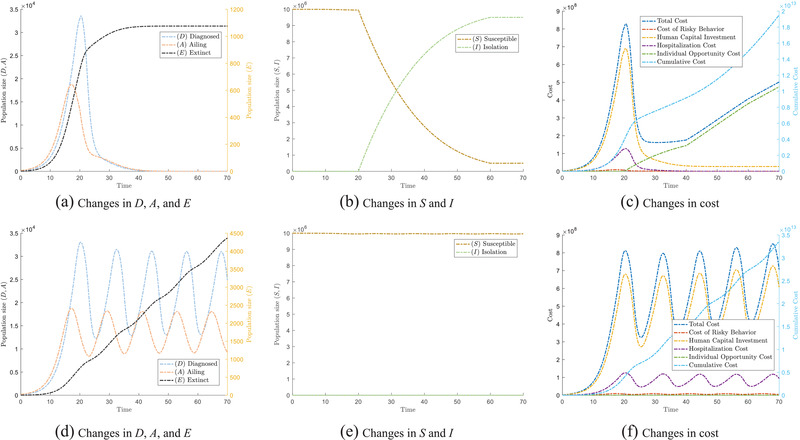
The epidemic will have different trends under different single strategies. (a–c) show the trend under lockdown, while (d)–(f) show the trend for an open community strategy. In particular, (a) and (d) show the changes of population which are affected by COVID, that is, Ailing (A), Diagnosed (D), and Extinct (E); (b) and (e) show the changes of Susceptible (S) and Isolated (I); (c) and (f) show the change in cost under different single strategies.