
Figure 3.
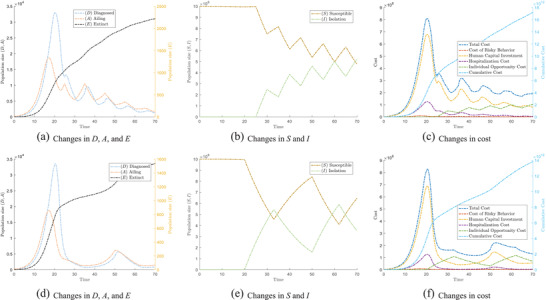
The epidemic evolves differently under different switching strategies. (a)–(c) show the tendency under the time‐based switching scheme. (d)–(f) show the tendency under result‐based switching scheme. In particular, (a) and (d) show the changes of population which are affected by COVID‐19, that is, Ailing (A), Diagnosed (D), and Extinct (E); (b) and (e) show the changes of Susceptible (S) and Isolated (I); (c) and (f) show the change in cost under different switching strategies.