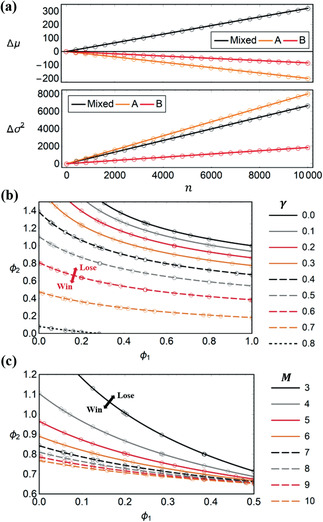
Figure 2.

a) Plot of and comparing theory (lines) and simulation (circles), realizing the strong Parrondo effect. Parameters are , , , , and . b,c) fair isoclines in ‐ parameter space for differing and , comparing theory (lines) and simulation (circles). Parameters are and , with for (b) and for (c).
