Figure 6.

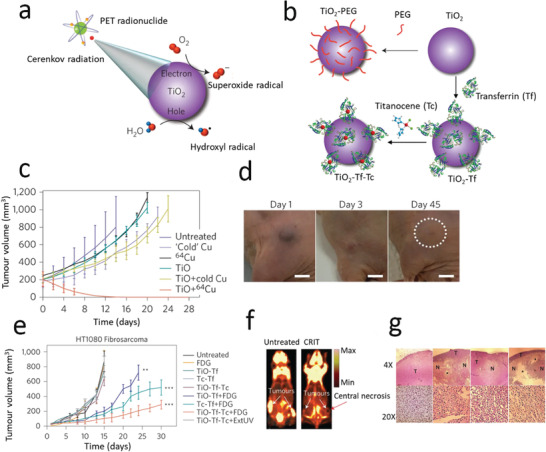
a) Schematic of CR‐mediated ROS generation from TiO2 NPs. b) Schematic of TiO2–PEG, TiO2–Tf, and TiO2–Tf–Tc synthesis. c) HT1080 tumor growth in mice using the NPs and 64Cu, together with controls. b) Reduction in tumor size at 1, 3, and 45 d post treatment (single dose of 2.5 µg mL−1 TiO2–PEG and 0.5 mCi/0.1 mL of 64Cu). e) Tumor growth following a single intratumoral administration of TiO2–Tf–Tc with FDG radionucleotide, together with controls. f) FDG‐PET imaging of untreated (left) and treated (right) mice with bilateral HT1080 tumors at 15 and 30 d, respectively. g) H&E stained treated and control tumor sections at two different magnifications (T‐tumor, N‐necrotic *‐denuded areas indicating macrophage‐assisted tumor cell clearance). Reproduced with permission.[ 198 ] Copyright 2015, Springer Nature.
