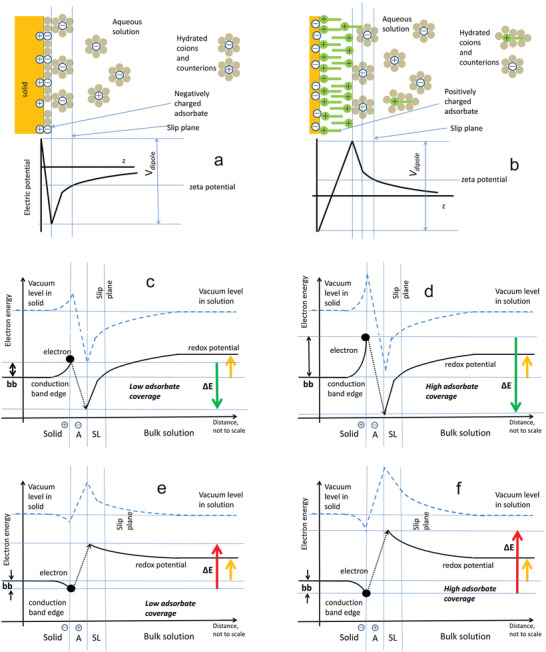
Figure 10.

Effect of surface adsorbate on redox energy for a reaction where an electron leaves the solid surface to form a radical species. a,b) Ionic and electric potential in the vicinity of a solid surface in the modified Stern model for (a) negatively charged surface and positively charged adsorbate (negative zeta potential) and b) positively charged surface and negatively charged adsorbate (positive zeta potential). c–f) Conduction band edge and redox potential in the presence of surface charges in solid charged adsorbate molecules and solution ions. The yellow arrow indicates the redox potential value (identical in panels c–f). Arrows labeled ∆E indicate positive (red) or negative (green) energies required for the electron (black dot) to take part in the redox reaction as marked. (The possibility of electron transfer to the adsorbate has not been noted here.) Note that the values of ∆E vary from positive to negative depending on the surface concentration of adsorbate and its charge. The vertical axis reflects the distance from the solid surface; distances are not to scale—the band bending in solids occurs on a µm scale, while the width of the adsorbate and distance from solid surface to the slip plane are within nm. The electron is assumed to be located at the solid surface, reflecting its location in an NP. Valence and other band edges in the solid have been omitted for clarity. (a,b) Adapted with permission.[ 220 ] Copyright 2012, Wiley‐VCH.
