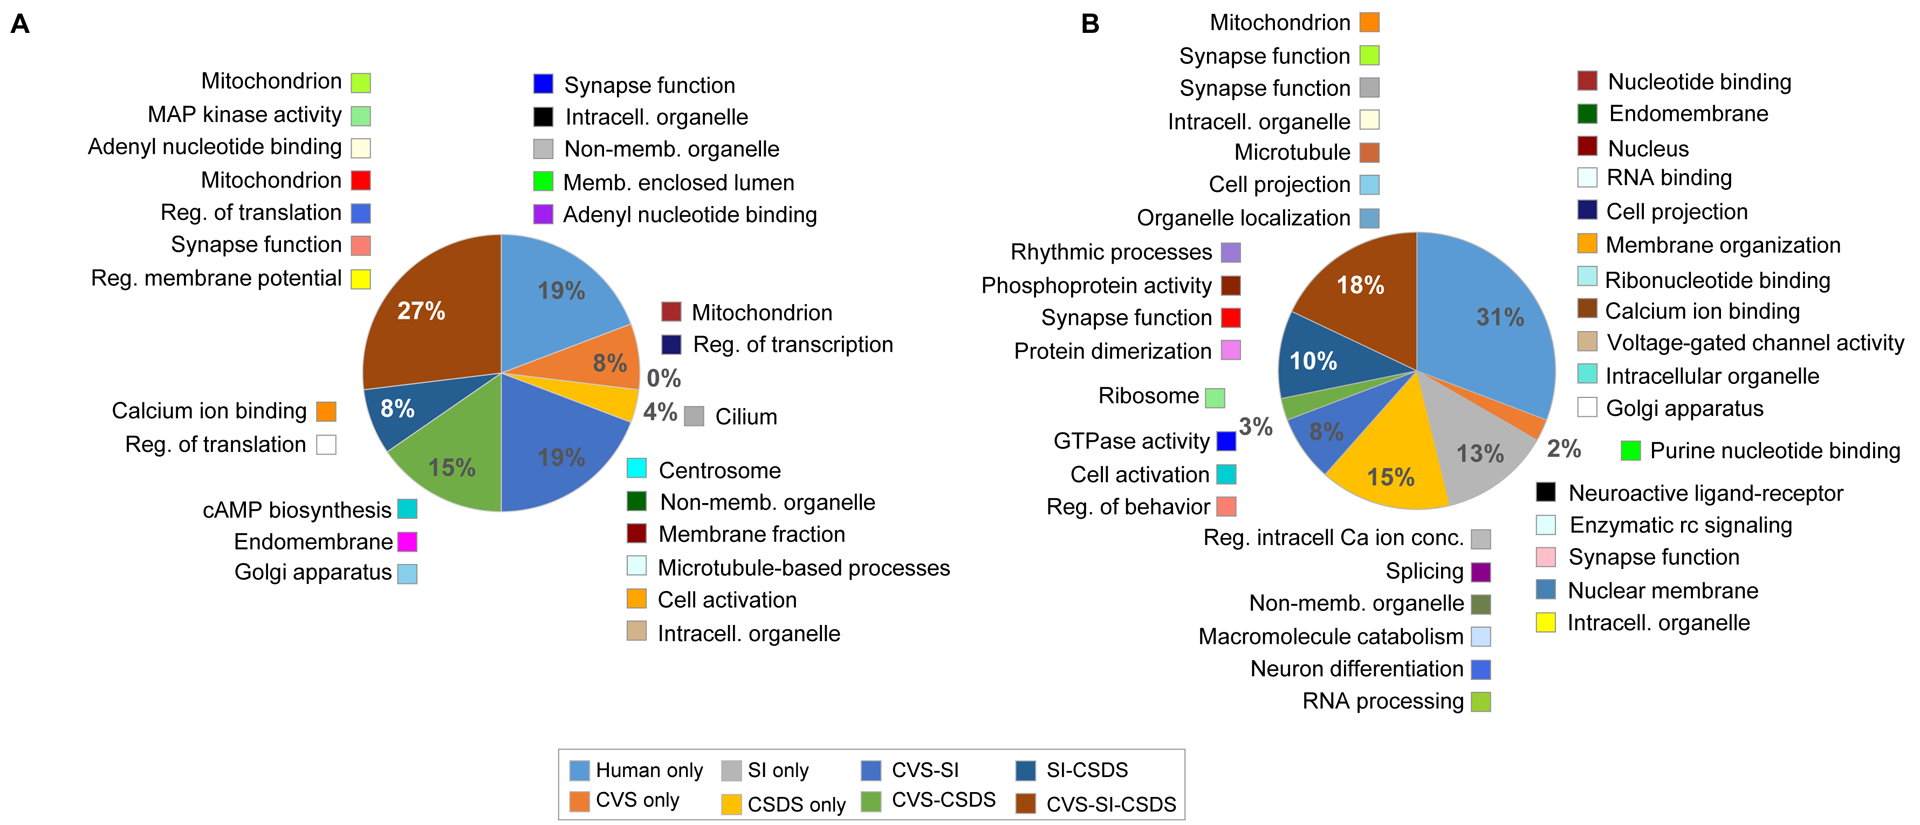
Figure 3. CVS, SI and CSDS reproduce the transcriptional structure of gene network in human brain.

Human-mouse interspecies module conservation in the mPFC (A) and in the NAc (B). Enrichment was performed on module membership by brain region with padj<0.05 at odd ratio (OR)>3. Pie charts are depicting the % of human modules conserved in each of the mouse models. Color legend is shown at the bottom of the figure. Besides each section of the pie appear the human modules (colored square) along with their ontological term. CVS: chronic variable stress, SI: social isolation, CSDS chronic social defeat stress.
