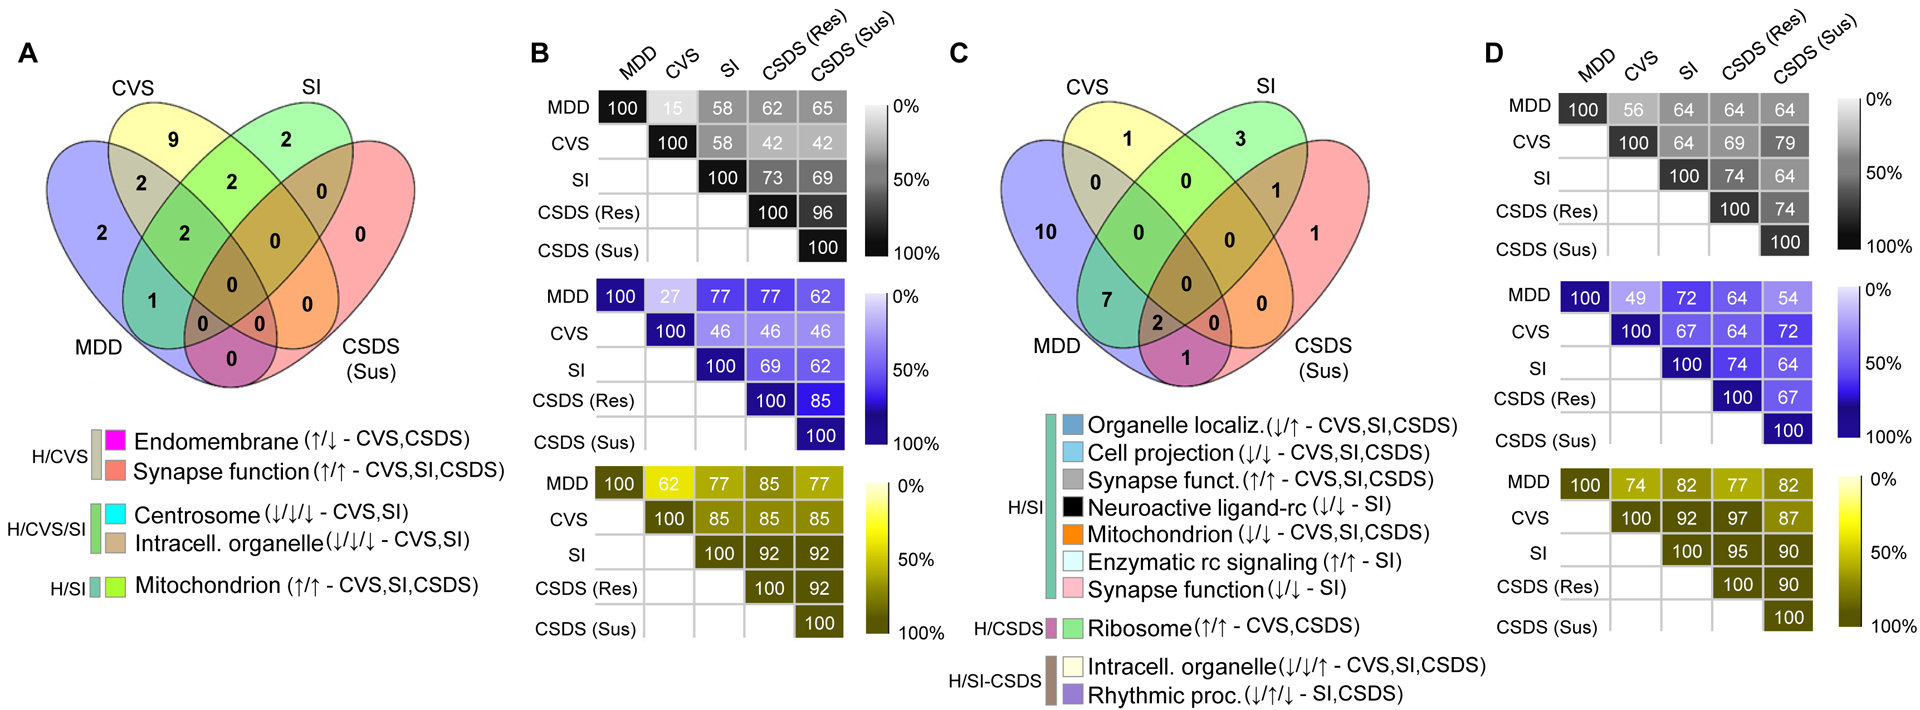
Figure 4. The transcriptional organization of gene networks associates with MDD in human and stress phenotypes in CVS, SI and CSDS.

A, C The proportion of interspecies preserved gene networks associated with MDD in human and stress in CVS, SI and CSDS susceptible differs by stress paradigms in the (A) mPFC and (C) NAc. Values in the Venn diagrams represent the number of gene networks preserved in human and mouse (padj<0.05; OR>3.0) and associated with MDD and stress (p<0.2) in human (blue) and CVS (yellow), SI (green) and CSDS susceptible (red). The legends below Venn diagrams in A and C represent the gene network (colored square) associated with their ontological terms commonly associated with the phenotype in human and mice. The arrows in the legend indicate directionality of the association in human MDD (up: increased in MDD compared to control, down: decreased in MDD vs control) followed by directionality of the association in respective mouse models. Human, CVS, SI and CSDS susceptible indications at the end of each network line represent whether each networks are conserved (based on module membership) in CVS, SI or CSDS or not (human only). B,D Heat maps showing the capacity of each mouse model to reproduce patterns of enrichment of genes differentially expressed in the human gene networks in the (B) mPFC and (D) NAc. Numbers in the maps show the percentage of human gene networks showing the same enrichment patterns (black: up and downregulated genes combined, blue: downregulated genes only and yellow upregulated genes only) for genes differentially expressed in each of the mouse models.
