
Figure 2.
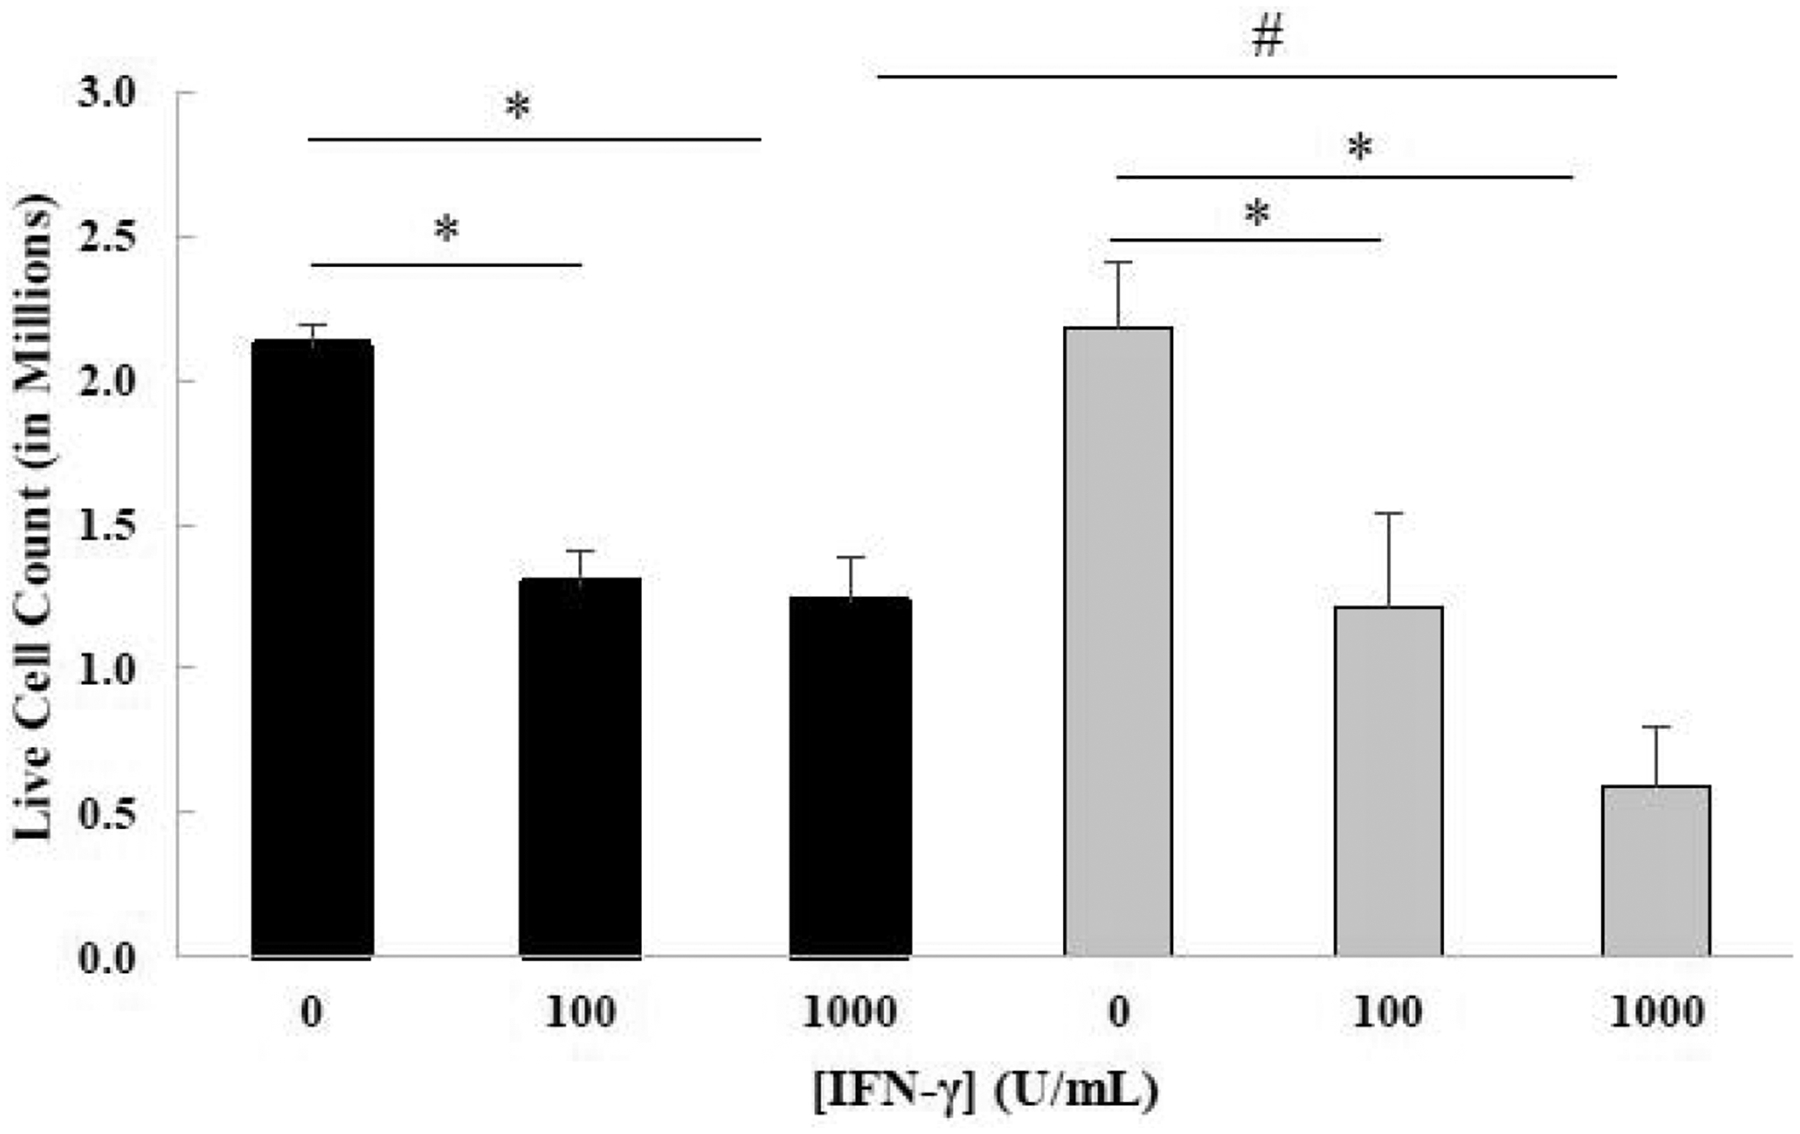
Live cell count of HAP1 (black bars) and GSK-3β 31bp (grey bars) cells treated with two different concentrations of IFN-γ for 48 hours. The live cell count of HAP1 and GSK-3β 31bp cells treated with 0, 100 or 1000 U/mL IFN-γ for 48 hours, determined in three separate experiments, were averaged to generate the data presented. Tukey’s test revealed that there was a significant difference between the 0 and 100 U/ml IFN-γ treatment groups and the 0 and 1000 U/mL IFN-γ treatment groups for both cell types (*p ≤ 0.05). Tukey’s test also revealed a significant difference between the HAP1 and the GSK-3β 31bp cells for the 1000 U/mL IFN-γ treatment groups (#p ≤ 0.05). Although the Tukey’s test did not reveal a significant difference for live cell count between GSK-3β 31bp cells treated with 100 and 1000 U/mL IFN-γ, a trend of decreasing number of live GSK-3β 31bp cells was observed as the treatment concentration increased from 100 U/mL to 1000 U/mL (p = 0.06). Error bars represent standard deviation (n=3).