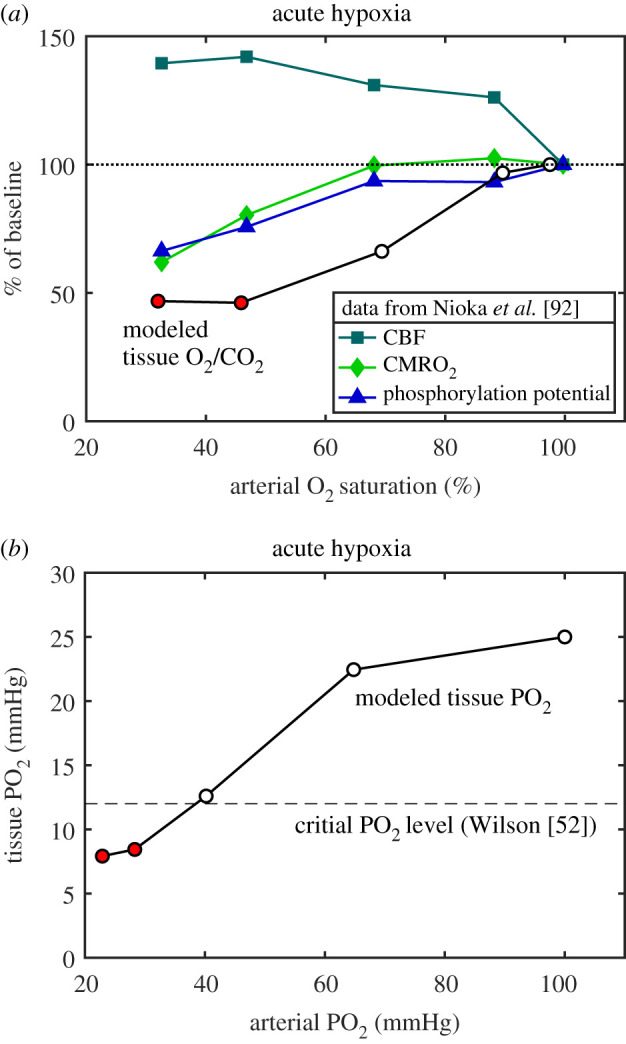
Figure 2.

Modelling experimental data to determine the critical level of tissue O2/CO2. (a) Data from Nioka et al. [92] for several stages of hypoxic hypoxia in a canine model as arterial O2–haemoglobin saturation was reduced, including measurement of the ATP phosphorylation potential, are plotted as a percentage of the normoxic value. The transport model was applied to these data to calculate the O2/CO2 ratio in tissue (circles). The ATP phosphorylation potential was degraded for the two most extreme hypoxic conditions, and for these states the tissue O2/CO2 ratio was reduced to about 50% of the normoxic baseline value (red circles). (b) For the same model, the calculated tissue PO2 values are plotted as a function of the arterial PO2 values. Based on a number of studies of mitochondria, Wilson [52] concluded that a PO2 of about 12 mmHg was a critical threshold below which the ATP phosphorylation potential would degrade (dashed line), in good agreement with the data of Nioka et al. [92] analysed with the transport model.
