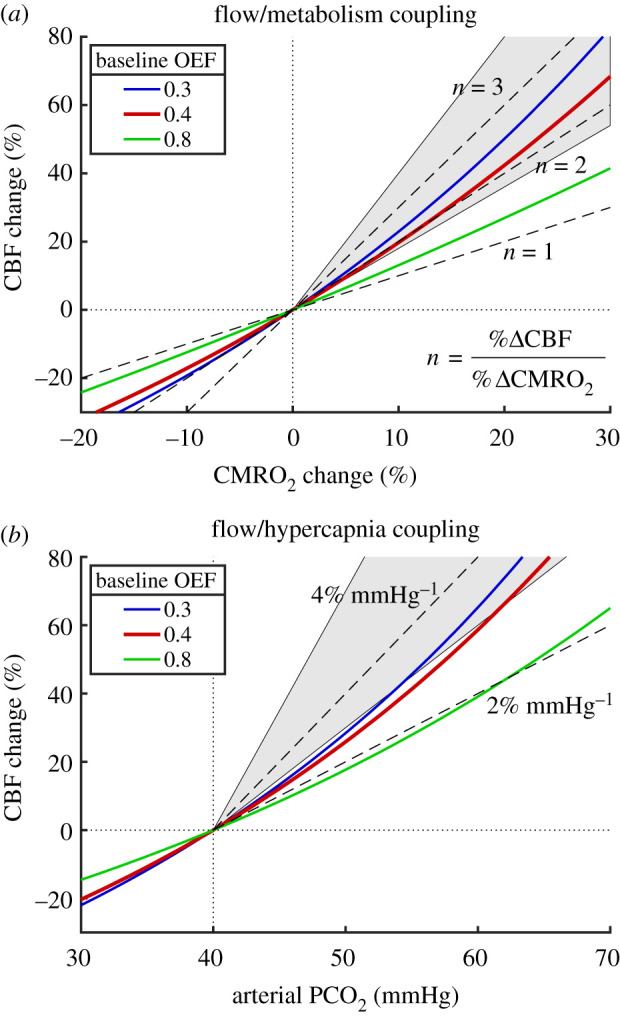
Figure 4.

Modelled CBF responses needed to preserve the [O2]/[CO2] ratio in tissue in response to increased CMRO2 and hypercapnia. (a) With increasing O2 metabolism, the required CBF change is shown for three different values of the baseline OEF (the red line is the typical value for the brain). Dashed lines show constant coupling ratios n of the fractional CBF change to the fractional CMRO2 change. The shaded area between n = 1.8 and n = 4 shows the approximate range of experimental results. (b) The required CBF change for increasing arterial CO2 shown for the same values of baseline OEF, with dashed lines indicating constant slope values, and the shaded area between slopes of 3 and 7% mmHg−1 approximates the range of reported experimental values.
