Figure 5.
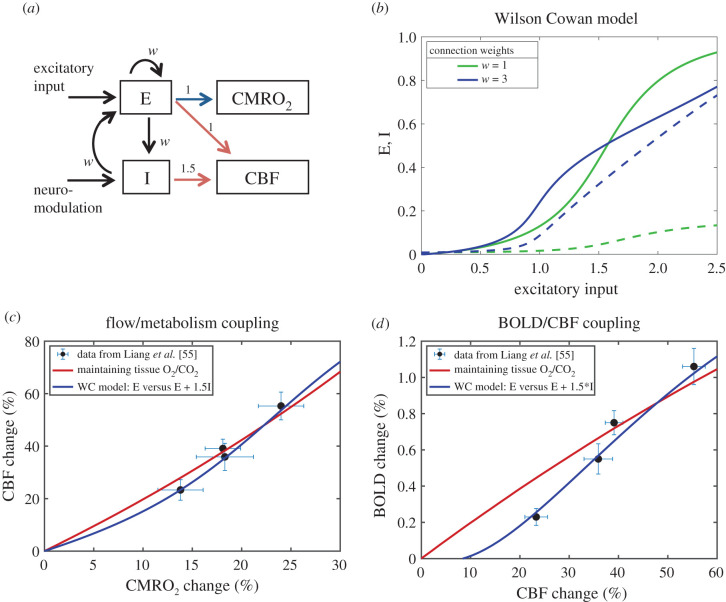
A speculative mechanism for control of CBF through feed-forward signals from neural activity. (a) The Wilson–Cowan (WC) model [101] was used to model in a simple way the dynamics of interactions of excitatory (E) and inhibitory (I) neural populations driven by an increasing external excitatory input to the E population. The weights for the different interactions were taken to be the same value w. As a proof of concept, CMRO2 was assumed to be driven by E (blue arrow) and CBF was assumed to be driven by both E and I (red arrows), with a higher weighting for inhibitory activity. (b) Curves of the activities of the E (solid lines) and I (dashed lines) populations as the input increases are shown for w = 1 and w = 3. For higher w, the E population is more sensitive to weaker input values, with activity rising faster owing to the increased self-excitation of the E population, and at higher input values E rises more slowly owing to a strong steady rise in I activity. (c) Data from Liang et al. [55] showing the estimated CMRO2 changes and the measured CBF changes (mean ± s.e.m.) from a calibrated BOLD study of effects of increasing contrast of a visual stimulus in humans. The red curve is the curve calculated to preserve tissue O2/CO2 (from figure 2a). The blue curve is calculated from the WC model with w = 3 with the assumption that %ΔCMRO2 ∼ E and %ΔCBF ∼ E + 1.5I, with the same proportionality constant for both chosen to make the largest input value for the curves in panel (b) correspond to %ΔCMRO2 = 30%. (d) Measured BOLD and CBF responses from Liang et al. [55] and the predicted BOLD curves for the constant O2/CO2 model (red) and the WC model (blue). The WC feed-forward model gives a reasonably good approximation of the CBF/CMRO2 coupling needed to preserve tissue O2/CO2 (panel c), but the BOLD sensitivity to subtle differences in the balance of CBF and CMRO2 creates some divergence of the predictions of the BOLD signal for the two models, with the WC model providing a better fit to the experimental data (panel d).

