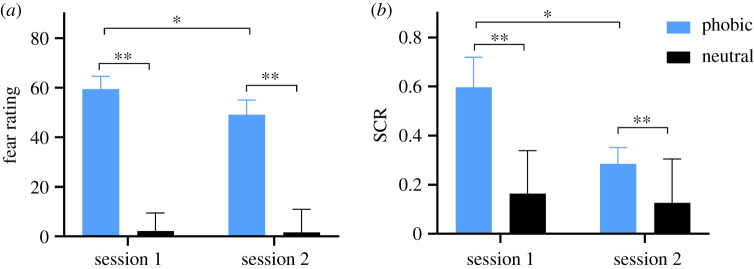
Figure 1.
Bar charts depict (a) subjective fear ratings (N = 29) and (b) mean skin conductance responses (N = 27) to mental imagery of phobic stimuli (spiders) and neutral stimuli (gloves) during the experimental procedure in sessions 1 and 2. Error bars represent standard error of mean. *p < 0.05, **p < 0.001.

