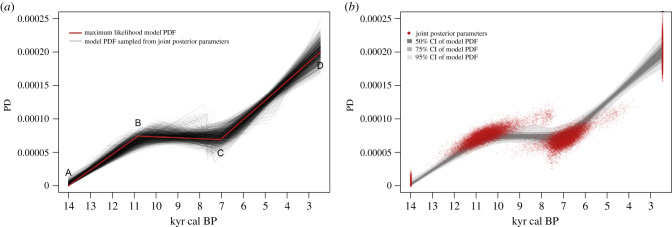
Figure 7.
Credible intervals of the 3-CPL model. (a) Model PDFs using the joint parameters of 1000 samples from the joint posterior parameter distribution (black) and ML parameters (red), hinge points marked A–D. (b) The 50%, 75% and 95% credible intervals (grey) of all model PDFs (grey), and parameter values (red), sampled from the joint posterior parameter distribution. (Online version in colour.)

