Figure 1.

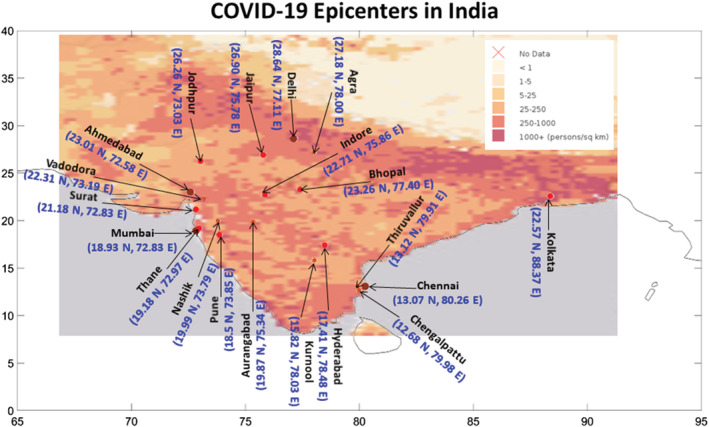
Population density map (color shading) in India and COVID‐19 distribution (dots, updated by 15 May). The epicenters (infection count >500) are marked with dots.

Population density map (color shading) in India and COVID‐19 distribution (dots, updated by 15 May). The epicenters (infection count >500) are marked with dots.