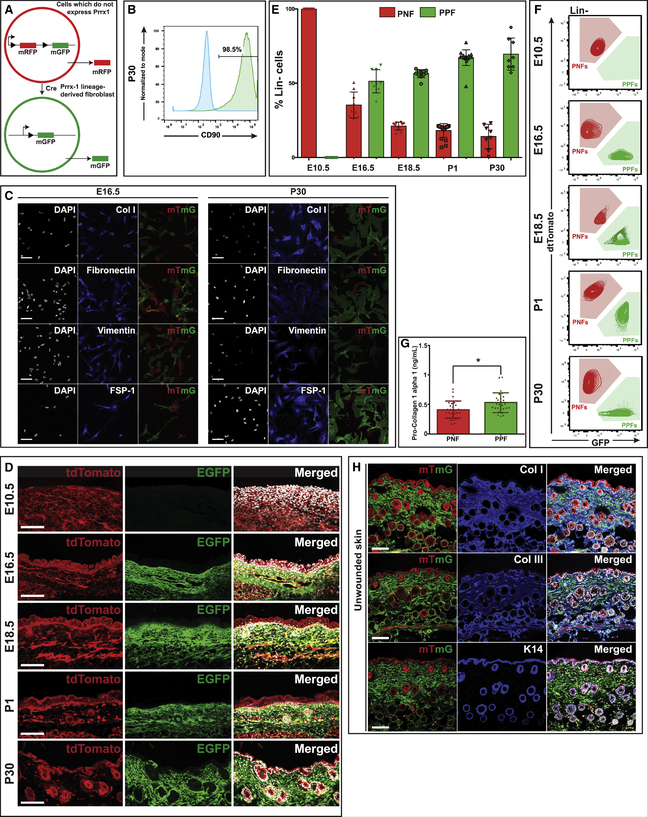
Figure 1. PPFs and PNFs Represent Two Distinct Lineages of Fibroblasts within the Ventral Dermis.
(A) Schematic demonstrating mTmG reporter system. PNFs do not express Prrx1 and are thus red due to production of the membrane monomeric red fluorescent protein (mRFP) versus PPFs (Prrx1 lineage-derived fibroblasts) that are green due to production of the membrane monomeric green fluorescent protein (mGFP).
(B) FACS analysis of PPFs harvested from ventral skin of P30 Prrx1Cre;R26mTmG mice, demonstrating expression of characteristic fibroblast marker CD90 (Thy-1) (n = 6).
(C) Immunohistochemical staining of fibroblasts (Lin− PPFs, green; Lin− PNFs, red) FACS isolated from E16.5 (left) and P30 (right) Prrx1Cre;R26mTmG mice and cultured in vitro. Immunostaining for collagen type I (first row), fibronectin (second row), vimentin (third row), and fibroblast-specific protein-1 (FSP-1) (fourth row). DAPI (white; left columns); fibroblast markers (blue; middle columns); tdTomato and EGFP merged (red and green, respectively; right columns). Scale bar, 200 μm (n = 6).
(D) Histological analysis of ventral skin harvested from Prrx1Cre;R26mTmG mice at E10.5, E16.5, E18.5, P1, and P30 demonstrating absence of PPFs at E10.5 and increasing presence of PPFs throughout the ventral dermis at later time points. tdTomato (left column), EGFP (middle column), and merged with DAPI (white) (right column). Scale bar, 100 μm (n = 9).
(E) Bar graph showing the percentage of Lin− cells that are PPFs versus PNFs as assessed by FACS in ventral skin from Prrx1Cre;R26mTmG mice at E10.5, E16.5, E18.5, P1, and P30 (n = 9).
(F) Corresponding FACS plots showing relative abundance of PPFs (Lin−GFP+) and PNFs (Lin−tdTomato+) in ventral skin from Prrx1Cre;R26mTmG mice at E10.5, E16.5, E18.5, P1, and P30 (n = 9).
(G) Intracellular pro-collagen 1-alpha 1 in freshly isolated PPFs from unwounded skin of P30 Prrx1Cre;R26mTmG mice was significantly greater than that in PNFs (*p = 0.014) (n = 6).
(H) Immunohistochemical analysis of ventral skin from P30 Prrx1Cre;R26mTmG mice demonstrating overlap of PPFs (green) with secreted collagens type I (top row) and type III (middle row). No overlap is observed with keratin 14 staining (bottom row), which localizes to the epidermis and surrounding hair follicles; tdTomato and EGFP (red and green, respectively; left column); immunostaining for ECM markers (blue; middle column); merged with DAPI (white; right column). Scale bar, 100 μm (n = 9). Data are represented as mean ± SD.

