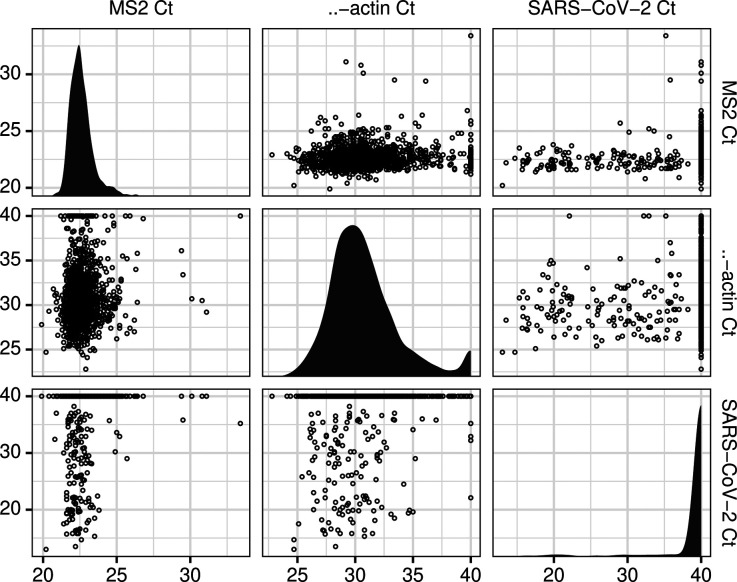
Figure 1: Distribution and relationships of Ct values for SARS-CoV-2, β-actin, and MS2 DNA positive control.
A matrix plot depicting the observed cycle of threshold values for SARS-CoV-2 RT-PCR, with MS2 DNA positive control and β-actin specimen quality control over 1311 consecutive clinical assays run between March 26 and July 4, 2020. Panels on the diagonal present the distribution of each target’s Ct values. Panels off the diagonal present the relationship between Ct values for each pair of targets. Ct for specimens without detectable SARS-CoV-2 or β-actin were imputed at 40 cycles.

