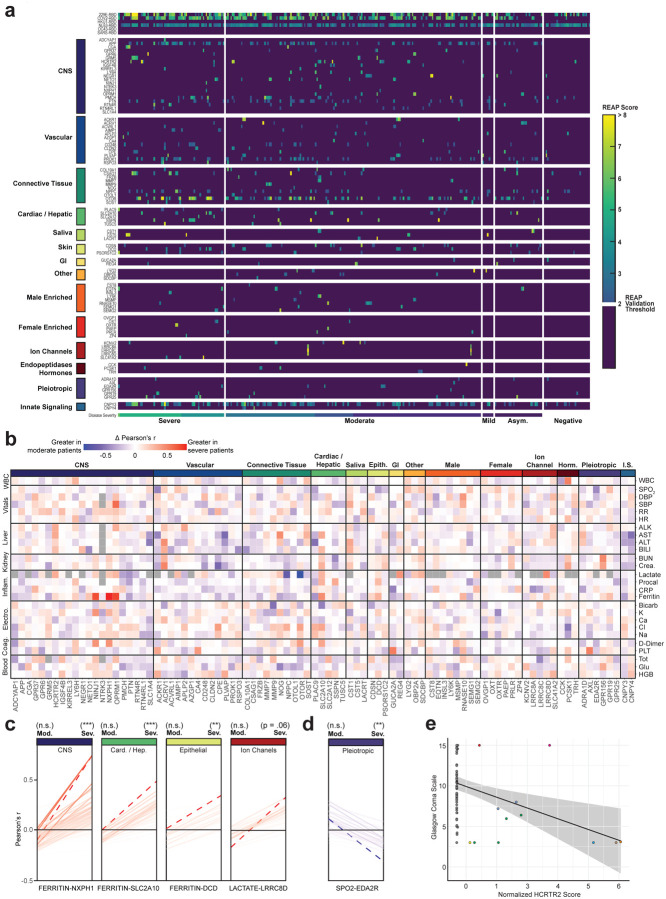
Figure 4: Autoantibodies targeting tissue-associated antigens correlate with disease severity and clinical characteristics in COVID-19 patients.
a, Heatmap of tissue-associated REAP score stratified by disease severity. Scores below the REAP Validation Threshold of 2.0 were set to 0 to aid interpretation of significant hits. b, Difference matrix of Pearson’s r for tissue-associated antigen REAP scores and normalized time-matched clinical laboratory values between severe (n = 93) and moderate (n = 162) COVID-19 patient samples (Δ r = severe r - moderate r). Gray squares indicate r that were unable to be calculated due to missingness of the clinical variable. c,d, Change in Pearson’s r for antigen-clinical variable pairs between severe and moderate COVID-19 samples, stratified by positive (red, c) and negative (blue, d) Δ r. Antigen-clinical variable pairs with greatest Δ r are annotated and indicated with dashed lines (red). Significance of r was determined using two-sided t-tests. e, Correlation of normalized HCRTR2 REAP scores with Glasgow Coma Scale scores in severe COVID-19 samples. Blue line shows a linear regression fit. Samples from the same patient were indicated with the same color points. Longitudinal samples from the same patient were included in all analyses in this figure. *P ≤ 0.05, **P ≤ 0.01, ***P ≤ 0.001, ****P ≤ 0.0001.

