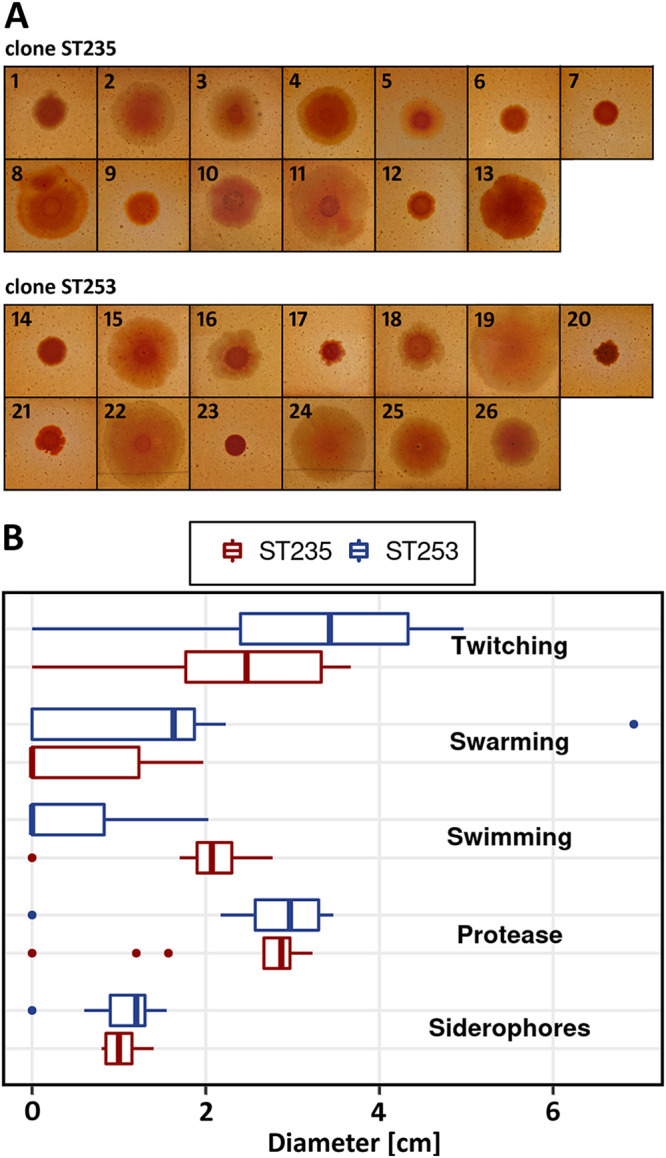
FIG 3.

Phenotypic comparisons of ST235 and ST253 isolates. (A) Colony morphology after growth on Congo red agar plates. (B) Boxplot summarizing motility and secretion assay results for the two clonal lineages. Displayed diameter values represent the mean size of motility zones, or halos formed by protease and siderophore secretion, on the corresponding agar plates. Motility and secretion assays were performed in triplicates for each tested isolate. For each clone, 13 isolates were tested. Clone ST235: 1, 60P57PA; 2, W15Dec14; 3, BW-PB-6; 4, BW-PB-7; 5, BW-PB-11; 6, BW-PB-12; 7, AI-BN-7; 8, B6065; 9, MCF33 (a); 10, MCF108 (a); 11, MCF244 (a); 12, MCF639 (a); 13, HCF400 (a). Clone ST253: 14, PA14; 15, 110E8; 16, K4; 17, K7; 18, HCF202 (a); 19, HCF209; 20, MCF228 (a); 21, Zw61 (a); 22, Zw86_2; 23, MCF37; 24, SS8; 25, 012SA1; 26, HCF212. Isolates marked with (a) displayed autolysis upon growth on blood agar plates. Origin and isolation information for these isolates is included in Data Set S1.
