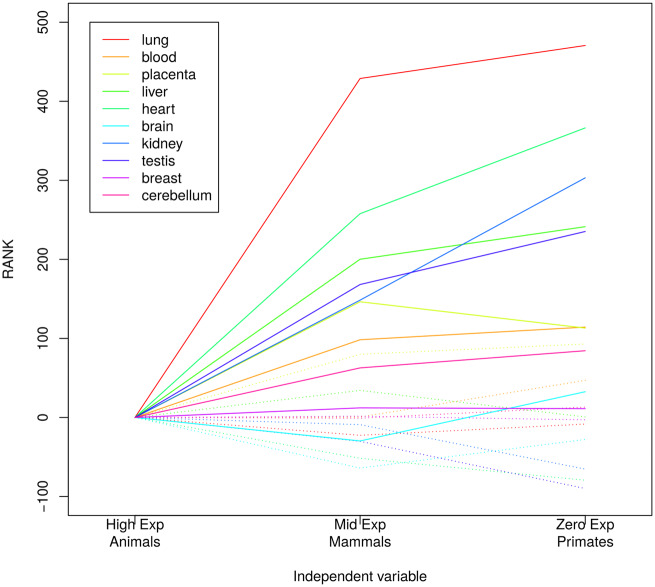
Fig. 3.
The effect of microRNA conservation and expression level on the frequency of target alleles. Rank differences in our linear model (see Materials and Methods) explained by expression (solid lines) and conservation (dashed lines) levels for ten different tissues. Highly expressed and conserved in animals microRNAs were taken as the intercept of the model (rank zero).

