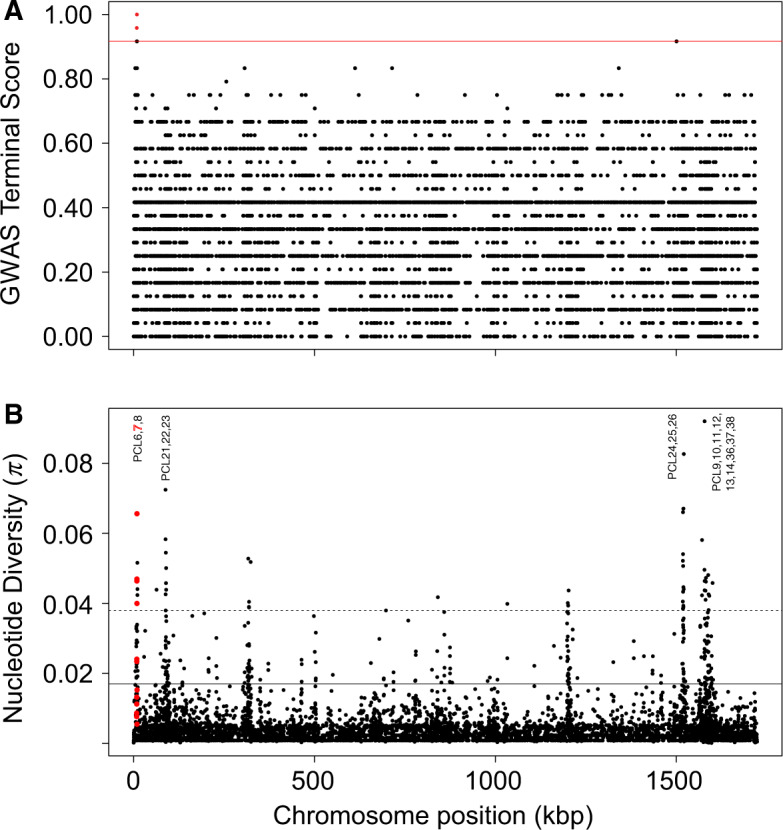
Fig. 2.

Genome scans of the 24 genome-sequenced Pasteuria ramosa clones. (A) Manhattan plot of the GWAS terminal test examining association between infection phenotype (relative to host clone HU-HO-2) and genetic polymorphisms across the tips of the P. ramosa phylogenetic tree. Red horizontal line indicates the significance threshold above which points indicate significant associations. Red points indicate significant polymorphisms, all located within the Pcl7 gene. (B) Nucleotide diversity (π). Each dot represents the average value of a given summary in a nonoverlapping window of 100 bp. Red dots represent bins that occur within the Pcl7 coding sequence. The horizontal solid black line delimits the 95% quantile, and the horizontal dotted black line delimits the 99% quantile. Text labels indicate closely spaced clusters of other Pcl genes that were also found to exhibit high levels of nucleotide diversity.
