Fig. 1.
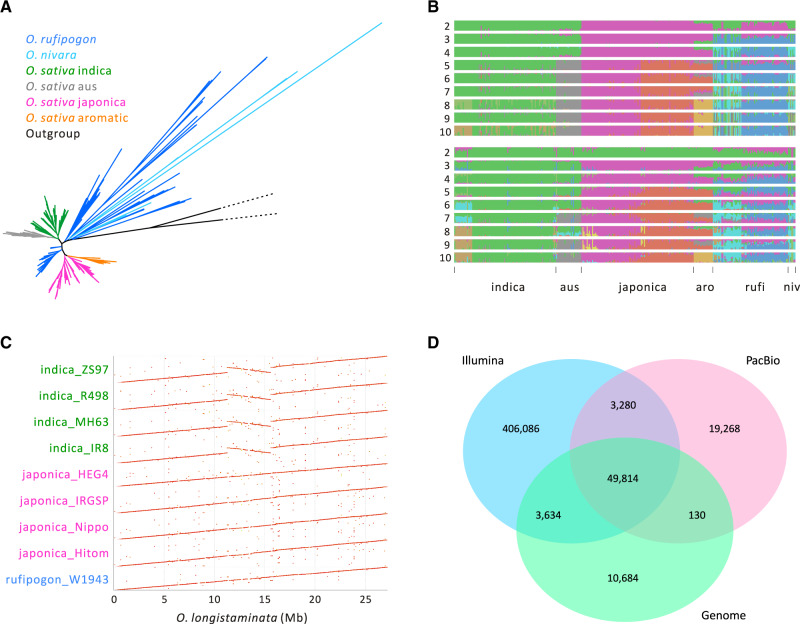
Features of the data and SV data sets (A) A phylogeny based on SNPs of n = 347 accessions of Asian rice with outgroups Oryza meridionalis and O. longistaminata. (B) Population structure inference based on SNPs (top) and SVs (below) for the short-read data set of 347 individuals. The accessions are arranged in the same order for the SNP and SV plots, the x-axis labels denote the different groups, with “aro,” “rufi,” and “niv” referring to aromatic, rufipogon, and O. nivara. (C) A dotplot of chromosome 6 showing the large (∼4.3 Mb) inversion in indica accessions relative to the O. longistaminata outgroup. The inversion is not shared with the japonica accessions in our sample. (D) A Venn diagram based on the combined results from three SV types (DEL, DUP, and INV) that compares SVs among three data sets based on short reads (Illumina, n = 347), long reads (SMRT, n = 10), and genome alignments (n = 14). Results for each SV type separately are available in supplementary figure S3, Supplementary Material online.

