Fig. 2.
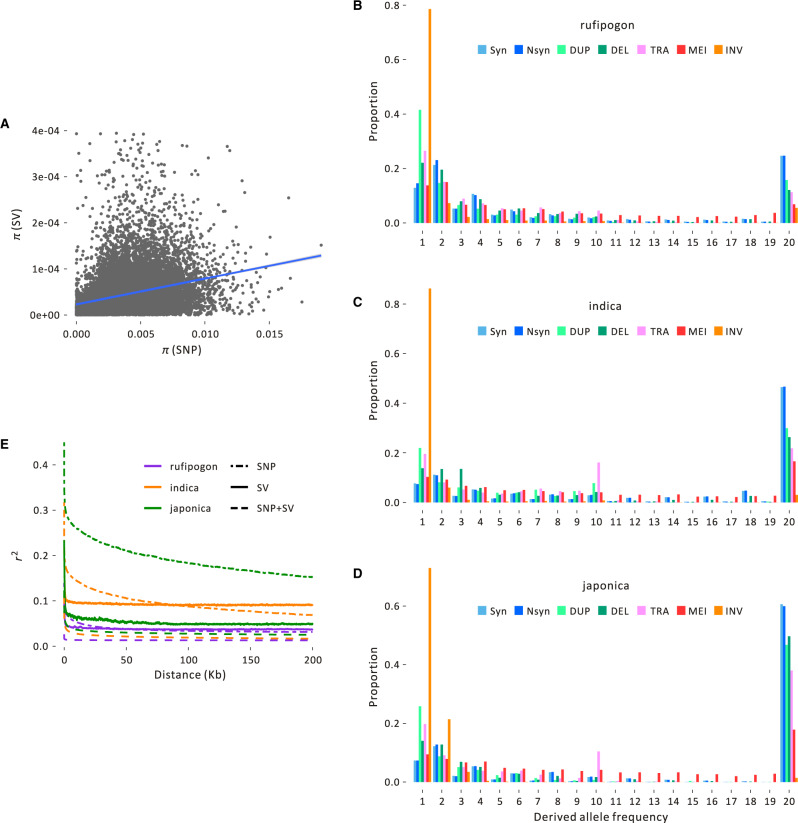
Population information about SVs. (A) The plot graphs SNP and SV average pairwise diversity (π) for the rufipogon sample across 20-kb windows of the genome, with the line indicating the correlation, which is weakly positive but significant (Pearson r = 0.0332, P = 1.07 × 10⁻⁵). Similar graphs for the japonica and indica samples are in supplementary figure S7, Supplementary Material online. Plots (B), (C), and (D) show the unfolded SFS of different types of SVs in (B) rufipogon, (C) indica, and (D) japonica. Each SFS contains synonymous SNPs (Syn), nonsynonymous SNPs (Nsyn), and SV events that fall into the duplication (DUP), deletion (DEL) translocation (TRA), mobile element insertion (MEI), and inversion (INV) categories. (E) The decay of linkage disequilibrium (LD) of SNPs and SVs measured by r2 for the three population groups based on SNPs, SVs, and SNPs+SVs.

