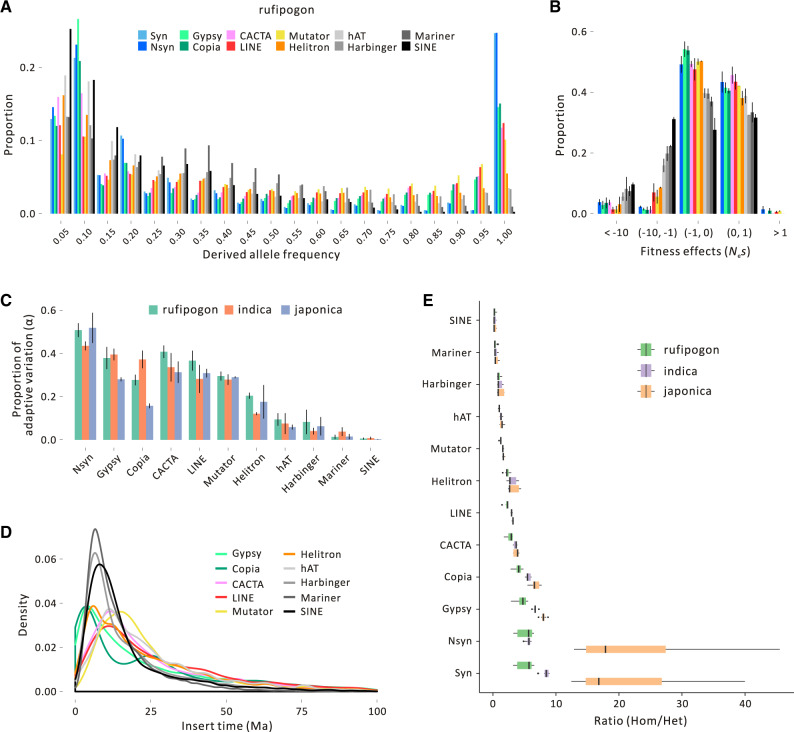
Fig. 4.
Features of TE diversity in rice. Plot (A) provides the SFS for ten element types along with synonymous SNPs (Syn) and nonsynonymous SNPs (Nsyn). This plot is for rufipogon; analogous plots for japonica and indica are provided in supplementary figures S14 and S15, Supplementary Material online. (B) The inferred distribution of fitness effects (DFE) in rufipogon relative to nSNPs. The y-axis provides the proportion of TE insertions, and the x-axis reports Nes. The color scheme for TE families is the same as (A). (C) The estimated proportion of adaptive variation (α) for each TE family and each of the three taxonomic groups. (D) Distributions of inferred insertion times for TE families in the Nipponbare reference. (E) The ratio of homozygous to heterozygous MEI variants in the three taxa for each TE family, which shows that the families under strong selection have relatively fewer homozygous variants.

