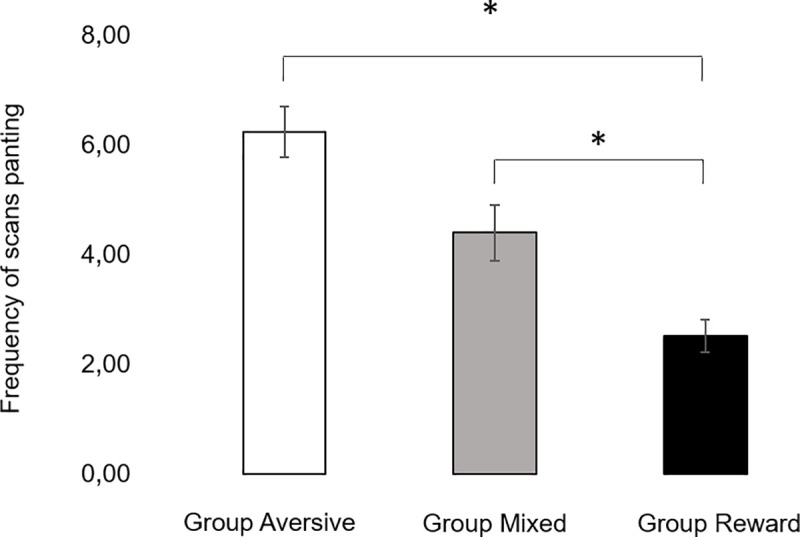
Fig 4.

Number of scans panting averaged across training sessions for Group Aversive (left), Group Mixed (middle) and Group Reward (right). Vertical bars show the SEM. *stands for statistically significant differences for least square means at α = 0.05.
