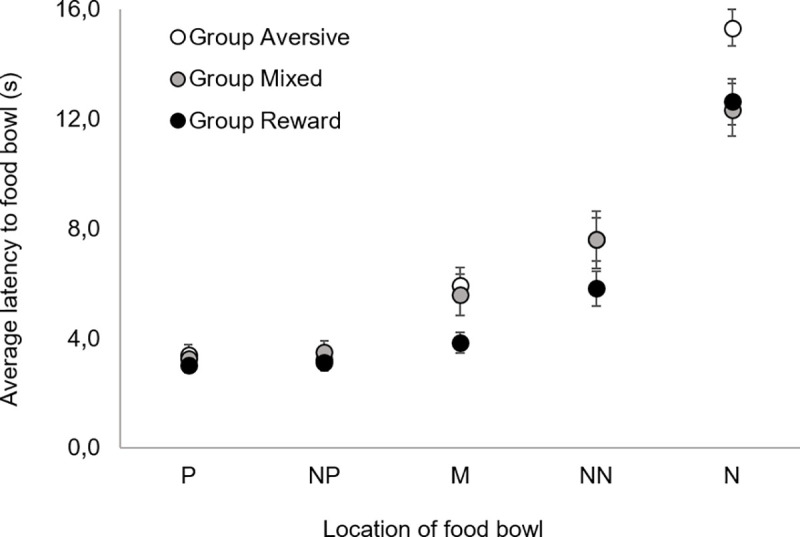
Fig 6.

Average latency to reach the food bowl as a function of bowl location: P—‘positive’, NP–‘near positive’, M–‘middle’, NN–‘near negative’, N–‘negative’, for Group Aversive (white circles), Group Mixed (grey circles) and Group Reward (black circles). Vertical bars show the SEM.
