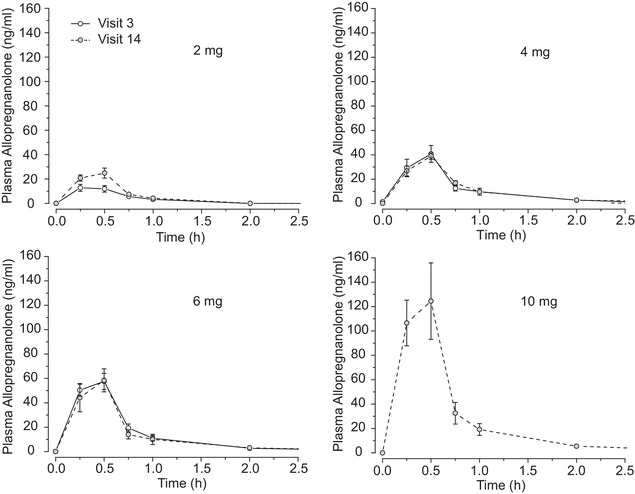
FIGURE 1.

Semilogarithmic mean plasma concentration‐time profiles of Allopregnanolone doses. Allopregnanolone 2 mg, 4 mg, and 6 mg doses shown at visit 3 and visit 14; 10 mg dose shown at visit 14 only. Measurements in all cases after 2 hours were below limit of quantitation (4 hours, 6 hours, 8 hours, and 24 hours). Error bars indicate standard error of the mean
