FIGURE 1.

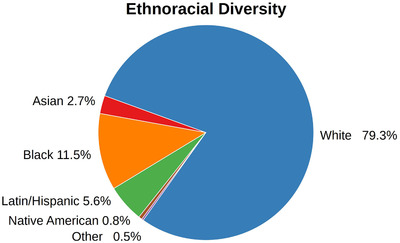
Combined ethnoracial diversity found across the investigated AD cohorts. Table S2 shows the individual compositions of each cohort

Combined ethnoracial diversity found across the investigated AD cohorts. Table S2 shows the individual compositions of each cohort