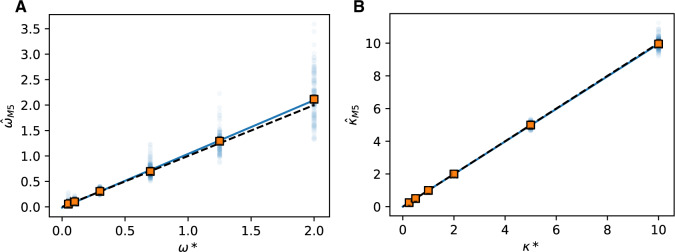
Figure 3.
Estimation of codon model parameters from amino acid data. A) Simulation ( ) and estimated (
 ) values of
  show a strong linear relationship (
 = 2 for all simulations shown). Squares represent the median
  for each
  ; points show estimates from individual alignments. Dashed line indicates
  ; solid line shows the line fit for the medians, with high values of
  slightly prone to overestimation (slope = 1.07, intercept = 0.0083,
  = 0.92,
  0). B) Estimates of
  show a similar pattern (
 = 0.3; slope = 1.00, intercept =
  0.0009,
  = 1.00,
  0).
0).

