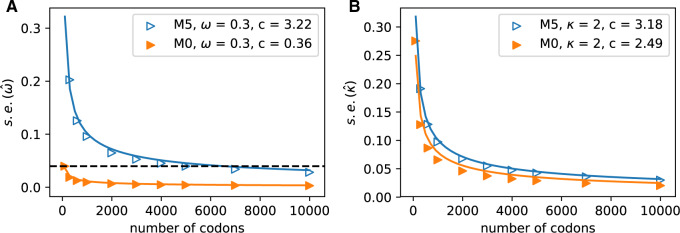
Figure 4.
Increasing the number of columns allows us to quantify how much information is retained in amino acid sequences (M5) relative to codon sequences (M0). The median standard errors of A)  and B)
  decrease for both models as codons are added. The dashed horizontal line in a) indicates the observed median standard error of
  for 100 codons under M0, and illustrates that M5 requires a substantially longer alignment to reach a comparable standard error. Fitting functions of the form
  to the median standard errors, with
  equaling the number of alignment columns, allows us to quantify the difference in information content. Equating
  with
with  indicates equivalent information content for
  codons in M0 and
  codons in M5: hence M5 recovers a fraction
  of the information available to M0. Alternatively, M5 has lost 100(1
  )% of the information available to M0.

