Figure 5.

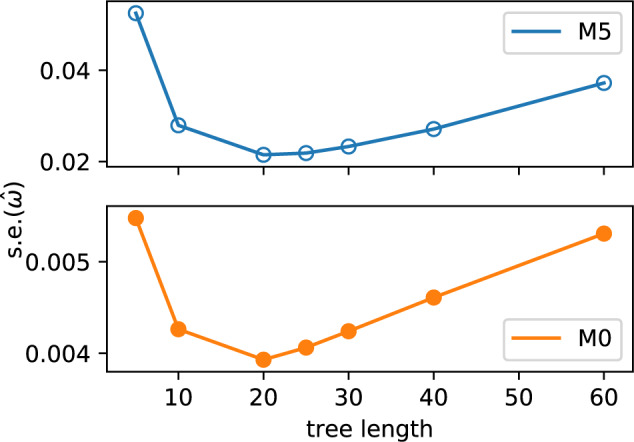
Tree length influences variance in estimates  for both M5 and M0, with intermediate values producing the lowest standard errors. Points show the median value across replicates. Note the difference in scale on the y-axis between M5 and M0.

Tree length influences variance in estimates  for both M5 and M0, with intermediate values producing the lowest standard errors. Points show the median value across replicates. Note the difference in scale on the y-axis between M5 and M0.