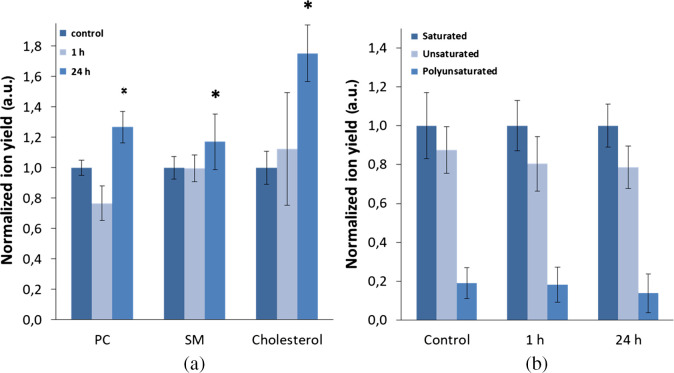
Fig. 5.
Lipid composition of CT26 plasma membranes obtained by ToF-SIMS: (a) positive ions. PC, phosphatidylcholine and SM, sphingomyelin. Data normalized to the control sample. (b) Fatty acids chains analysis in negative ions. Data normalized to saturated fatty acids. * Statistically significant difference with control, .

