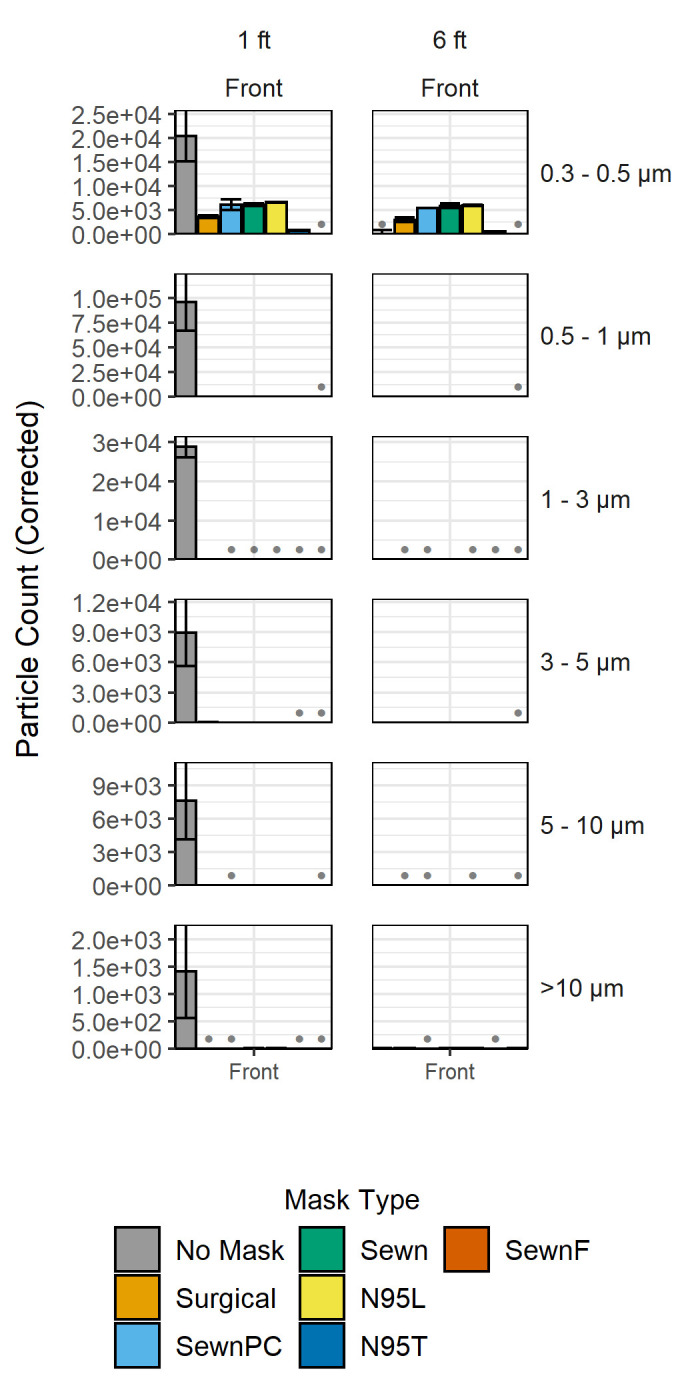
Fig 4. Background-corrected particle counts comparing facemask treatments in the open bench environment.

Each plot shows background-corrected particle counts for each of the facemasks, which are ordered from least to greatest pressure drop, at distances of one foot, three feet, and six feet (0.3 m, 0.9 m, and 1.8 m) away from the face model. The Front position is shown for each distance. Binning by particle diameter for each facemask is grouped together by row, in order of size from 0.3–10 μm, as described in Fig 2. Axes are scaled to each respective range, and gray bullet points at the baseline indicate negative corrected counts. Error bars indicate standard deviation for particle counts in each of the respective particle size bins from three independent measurements. A 3-factor MANOVA and subsequent 3-factor ANOVAs were performed in addition to Tukey's Honest Significant Difference tests p-values, relevant parameters, and analysis are shown as interactive maps, and contour plots and graphs of data from one foot, three feet, and six feet (0.3 m, 0.9 m, and 1.8 m) in the Front and Side positions are included in S3 File.
