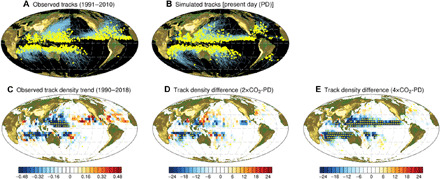
Fig. 1. PD and future TC genesis location and tracks.

(A and B) TC genesis location (yellow dots) and tracks (blue lines) from (A) observations and (B) PD simulation. (C) Linear trend of the observed TC track density (hours per day per year) for the period 1990 to 2018. (D and E) Track density changes (hours per day) in (D) CO2 doubling (2×CO2) and (E) CO2 quadrupling (4×CO2) conditions related to PD condition. Observational data are from IBTrACS4 during the 1990 to 2018 period. Track density was obtained by the number of TC tracks over 5 × 5 degree grid box. Yellow dotted areas in (C) to (E) indicate values for which the local null hypothesis of zero relation can be rejected at the 95% level based on a Student’s t test.
