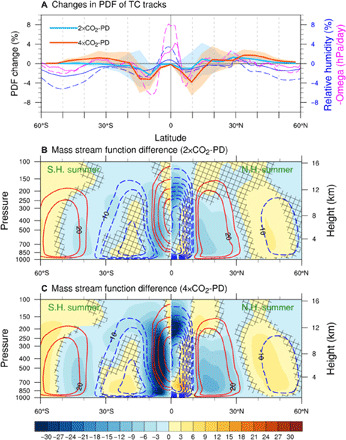
Fig. 2. Changes in latitudinal distribution of TC tracks and meridional overturning circulations.

(A) Changes in the probability density distribution (PDF) of the TC tracks as a function of latitude in 2×CO2 (light blue thick line) and 4×CO2 (red thick line) conditions relative to PD. Annual and zonal mean relative humidity (%) at 700 hPa (blue thin lines) and vertical velocity (hectopascals per day) at 500 hPa (magenta thin lines) in 2×CO2 (solid lines) and 4×CO2 (dashed lines) conditions. For consistency, the vertical velocity is multiplied by −1. Shadings indicate 1 SD of the year-to-year PDFs for 2×CO2 (blue) and 4×CO2 (red) conditions. (B and C) Climatological summertime mass stream function in PD (contours) and changes in mass stream function (shading) in (B) 2×CO2 and (C) 4×CO2 experiments. Summer mean is computed over June to November for the Northern Hemisphere (N.H.) and December to May for the Southern Hemisphere (S.H.). Values that are not statistically significant at 95% confidence level are marked by black cross-hatching.
