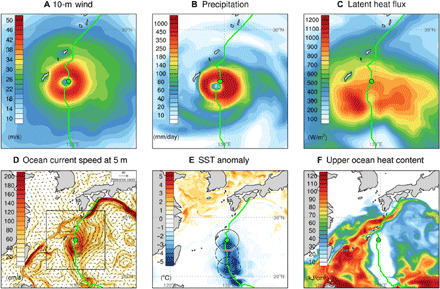
Fig. 3. Upper ocean response to the passage of a TC.

A snapshot of (A) 10-m wind speed (meters per second), (B) precipitation (millimeters per day), (C) latent heat flux (watts per square meter), (D) ocean current (vector) and its speed (shading) (centimeters per second) at a depth of 5 m (centimeters per second), (E) SST (°C) anomaly, and (F) upper OHC (kilojoules per square centimeter) in response to a TC case passing over the western North Pacific. The SST anomaly is calculated by subtracting the previous 14-day average. Green line indicates the track of the selected TC, and green circle indicates the center of the storm. Black box in (D) denotes the zoomed-in area in (A) to (C). The circle with black solid line in (E) represents the 200-km boundary from the storm center that is used to calculate maximum SST cooling (i.e., cold wakes), whereas circles with black dashed line are those for storms at 24 and 48 hours before.
