
Fig. 5. Accumulated SST cooling effect induced by TC activity.
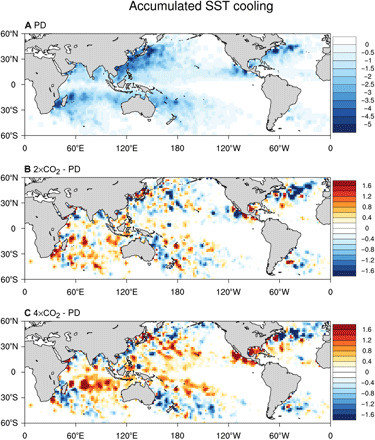
(A) Annually accumulated cooling due to TC passages in the PD experiment. The cooling effect is calculated by adding the SST anomaly within a circle of 200-km radius along the TC passages over a year. (B and C) Changes in SST cooling effect in (B) 2×CO2 and (C) 4×CO2 relative to PD. The patterns are interpolated to a 2 × 2 degree grid box. All fields are smoothed using a 9-point local average weighted by distance from the grid center.