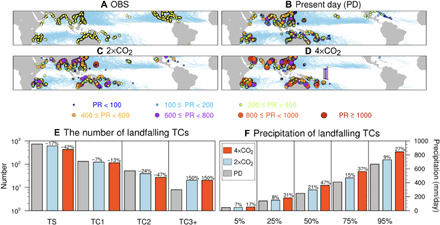
Fig. 6. Locations, precipitation, and intensity of landfalling TCs.

(A to D) TC tracks (light blue) and landfalling locations (yellow or colored circles) from (A) observation, (B) PD, (C) 2×CO2, and (D) 4×CO2 simulations. Colors in (B) to (D) indicate different range of precipitation (PR) averaged over a circle of 100-km radius from the storm center. (E) The number of landfalling TCs for each category from tropical storm (TS) to TC greater than category 3 (TC3+) based on the Saffir-Simpson scale in PD (gray), 2×CO2 (blue), and 4×CO2 (red) conditions. (F) Precipitation (millimeters per day) by the landfalling TCs at each percentile of 5, 25, 50 (median), 75, and 95%, respectively. Numbers above the bars indicate relative changes in the (E) TC number and (F) precipitation compared with PD values. To remove the impact of extratropical storms, landfalling TCs within 30°S to 30°N are considered. Vertical bars in (D) denote the “forbidden near equatorial zone” defined as a longitudinal average of the genesis location nearest to the equator between 30°E and 180°E for PD (gray), 2×CO2 (blue), and 4×CO2 (red), respectively.
