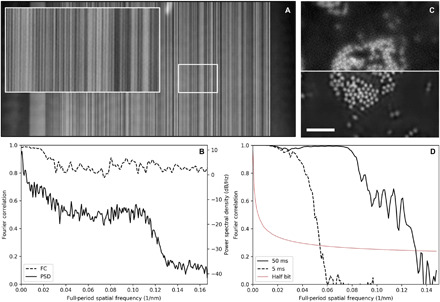
Fig. 1. Analysis of the microscope imaging resolution.

(A) Ptychographic scattering contrast image of a linear test pattern with 3-nm smallest features. The inset image is 1 μm wide. (B) FC and PSD analysis of the reconstructed image, averaged by horizontal line. The FC shows high correlation to a full-period resolution of 6 nm (reconstructed pixel size of 3 nm), while the PSD shows a roll-off at 8-nm full-period resolution. (C) Ptychographic optical density of a collection of Fe3O4 nanoparticles. The top half image uses a 5-ms x-ray exposure time, while the bottom half uses 50-ms exposure. Scale bar, 1 μm; pixel size, 3 nm. (D) FC analysis of the two exposure times, which indicate full-period spatial resolutions of 18 and 7.6 nm for the 5- and 50-ms exposure times, respectively.
