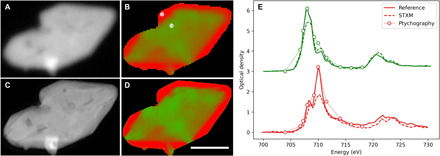
Fig. 2. Spectromicroscopy of a LixFePO4 microplatelet.

Conventional (A and B) and ptychographic (C and D) spectromicroscopy of LixFePO4 microplatelets. Shown are the average optical density (A and C) and the chemical composition map (B and D) where the two chemical components (LiFePO4 and FePO4) are presented in green and red, respectively. Scale bar, 1 μm; reconstructed pixel size, 5 nm. Point spectra from conventional scanning (dashed lines) and ptychographic modes (dotted lines with circles) are shown in (E). Reference spectra from pure materials (LiFePO4, green solid line; FePO4, red solid line) are also shown for comparison. The conventional STXM spectra show distortions that favor the physically larger chemical phase, whereas the ptychographic spectra more closely match the references. The reference and STXM spectra use a 0.5-eV energy step from 706 to 712 eV and a 1-eV energy step otherwise.
