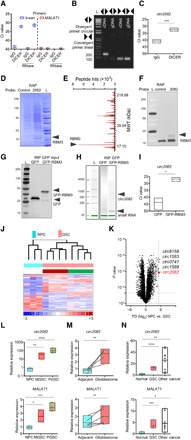
Fig. 3. DICER/RBM3 forms complex with circ2082.

(A) RIP of nuclear lysates with DICER antibodies followed by RNA isolation, RNase treatment, and qPCR (n = 3) using indicated primers. (B) Agarose gel of PCR products using cDNA or genomic DNA (gDNA) and indicated primers. (C) RIP of nuclear extracts from GSC using IgG and DICER antibodies, qPCR analysis with means ± SD. (D to F) Coomassie blue staining (D), mass spectroscopy peaks of circ2082-associated proteins (E), and Western blot (F) using GSC protein extracts upon RAP with control or anti-circ2082 probes (n = 3). (G to I) RIP of lysates from GSC transfected with GFP or GFP-RBM3 vector. Protein inputs analyzed by Western blot (G), RNA profile by Agilent Bioanalyzer (H), and circ2082 enrichment in RIP by qPCR with means ± SD (I). (J) Heatmap with a hierarchical clustering for NPCs (n = 3) and GSCs (n = 4 per subtype), (n = 1270 of 12,659 detectable, P < 0.05). Subtype identity: red, mesenchymal; green, proneural. (K) Volcano plot for NPCs (n = 3) and GSCs (n = 10) and the top five most up-regulated circRNAs. Dashed lines indicate P value and fold cutoffs. (L to N) qPCR analysis of circ2082 (top) and linear MALAT1 (bottom) with means ± SD in NPCs versus M GSCs (50.1- and 2.5-fold, respectively) and NPCs versus P GSCs (150.2- and 3.8-fold, respectively) (n = 4 per group) (L); adjacent brain versus glioblastoma (2.3- and 1.4-fold paired, respectively), matching lines identify pairs (n = 5) (M); and NPCs versus GSCs (12.8- and 3.9-fold, respectively), and NPC versus other cancers (27.1- and 4.6-fold, respectively) (nonmalignant cells, n = 6; GSCs, n = 3 per subtype; other cancers, n = 9) (N); P values: *P < 0.05, **P < 0.01, ***P < 0.001, and ****P < 0.0001.
