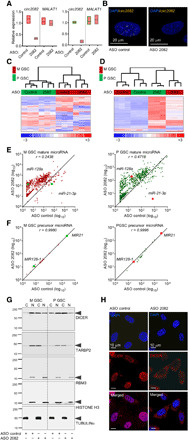
Fig. 4. The knockdown of circ2082 results in a widespread derepression of GSC microRNAome.

(A) qPCR analysis for circ2082 or linear MALAT1 in GSCs with means ± SD. GSC (green, proneural; red, mesenchymal; n = 3 per subtype) were transfected with ASO control or circ2082. (B) Representative FISH images of the circ2082 in GSC transfected with ASO control or circ2082 with a fluorescently labeled junction probe and nuclei stained with DAPI (n = 4). (C) Heatmap with a hierarchical clustering for GSCs transfected with ASO control or circ2082 (n = 3 each subtype) based on the most variable mRNA transcripts (n = 3740 of 31,555, P < 0.05). GSC’s subtype identity: red, mesenchymal; green, proneural. (D) Heatmap with an unsupervised hierarchical clustering for GSCs transfected with ASO control or circ2082 (n = 3 per subtype) based on levels of 756 mature microRNAs. GSC’s subtype identity: red, mesenchymal; green, proneural. (E) Scatterplots for GSCs (M GSC: red, left; P GSC: green, right) transfected with ASO control or circ2082 (n = 3 each) based on levels of 756 mature microRNAs. (F) Scatterplots for GSCs (M GSC: red, left; P GSC: green, right) transfected with ASO control or circ2082 (n = 3 each) based on levels of 22 precursor. (G) Representative Western blotting of cytosolic (C) and nuclear (N) fractions of GSCs (n = 4) transfected with ASO control or circ2082. (H) Representative images of cultured GSC (n = 3) transfected with ASO control or circ2082. DAPI staining (blue) and DICER immunohistochemistry staining (red) analysis were performed.
