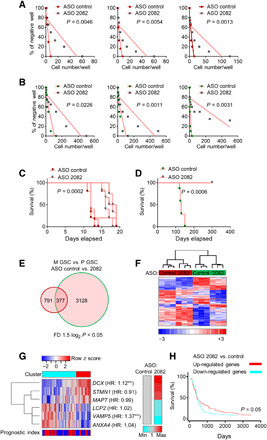
Fig. 5. The knockdown of circ2082 mitigates tumorigenicity of GSCs.

(A and B) Representative sphere frequency assays using linear regression plot. GSCs (n = 3 per subtype) were transfected with ASO control or circ2082. P values are indicated. (C and D) Kaplan-Meier curves of mice intracranially injected (n = 5 per group) with GSCs (red, mesenchymal; green, proneural) transfected with ASO control or circ2082. P values are indicated. (E and F) GeneVenn analysis (E) and heatmap with hierarchical clustering (F) for GSCs transfected with ASO control or circ2082 (n = 3 per subtype) based on the most variable mRNA transcripts in both subtypes (n = 377 of the total 31,555), fold difference (FD) 1.5 log2, and P < 0.05 are shown. GSC’s subtype identity: red, mesenchymal; green, proneural. (G) Heatmap of the most varied genes (n = 6) in GSC with circ2082 knockdown with color annotations according to profile similarity and prognostic index stratification cluster based on TCGA database (left) and average relative expression based on qPCR analysis (n = 3) as a color bar (right). Molecule names are annotated with hazard ratios (HR) from Cox analysis; **, hazard ratios (HRs) with P ≤ 0.05. (H) Kaplan-Meier curve survival analysis based on six gene signatures in the TCGA database stratified according to their cluster membership [see (G)].
