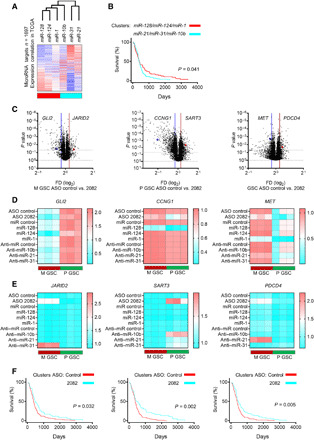
Fig. 6. The circ2082-dependent footprint is mediated via the rearrangements of the microRNAome.

(A) Heatmap displaying the clustering of expression correlation of genes (n = 1697) and selected microRNAs using the TCGA database. The correlation value (blue, negative and red, positive) and annotations of profile similarity (bottom bar) are shown. (B) Kaplan-Meier curve survival analysis based on genes associated with six microRNA in the TCGA database and stratified according to their cluster membership [see (A)]. (C) Volcano plots of genes [n = 1697, see (A)] for M GSCs (n = 3, left), P GSCs (n = 3, middle), and all GSCs (n = 6, right) transfected with ASO control or circ2082 are shown. The selected deregulated targets are shown. Lines indicate a P value and fold difference cutoffs. (D and E) qPCR analysis for indicated mRNAs upon the treatment by ASO circ2082 or tumor-suppressive microRNAs (D) and ASO circ2082 or oncogenic anti-microRNAs (E) in GSCs (n = 3 per subtype). (F) Kaplan-Meier curve survival analysis using TCGA database and stratified according to their cluster membership (see fig. S6, D to F) after circ2082 knockdown in M GSCs (left), P GSCs (middle), and all GSCs (right).
