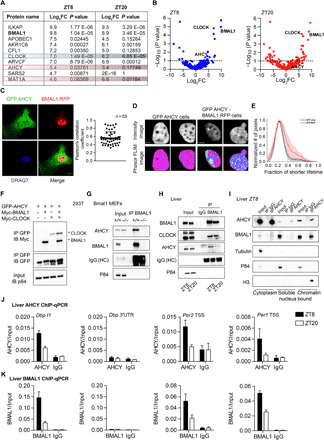
Fig. 1. AHCY forms a complex with BMAL1.

(A) Table showing the top BMAL1-interacting proteins in the nucleus ranked by log2 fold change (FC) value at ZT8. (B) Volcano plot of MS analysis of BMAL1-interacting proteins in the nucleus. The x axis indicates log2 ratio of normalized intensity (iBAQ) of proteins found in BMAL1 to IgG (n = 4). (C) AHCY colocalization with BMAL1 in the nucleus. GFP-AHCY and RFP-BMAL1 were imaged by confocal microscopy in MEF cells. The Pearson’s R coefficient indicates the extent of colocalization of GFP-AHCY and RFP-BMAL1 (n = 53). Scale bar, 10 μm. (D) Intensity (GFP channel) and phasor mapped fluorescence lifetime images (FLIM) of GFP-AHCY and GFP-AHCY/BMAL1-RFP MEF cell nucleus. Two representative cells are shown (n > 30 cells). Scale bar, 1 μm. (E) Histogram of the fractional intensity distributions of the donor (GFP) in the nucleus. The increasing fractional intensity of the shorter lifetime (FRET) component reflects the presence of FRET (red plot). The two average plots are separated by P < 0.001 (Kolmogorov-Smirnov test). (F) Co-IP experiment using 293T cells transiently transfected with the indicated plasmids (IP, immunoprecipitation; IB, immunoblot). (G) Co-IP experiment from nuclear extract of BMAL1 null MEFs with anti-BMAL1 antibody. (H) Co-IP experiment from liver nuclear extracts using anti-AHCY antibody at indicated zeitgeber times (ZT8 and ZT20). (I) Co-IP experiment from liver cytoplasmic, soluble nuclear, and chromatin-bound fractions using anti-AHCY antibody at the indicated zeitgeber time (ZT8). (J) AHCY ChIP at the Dbp, Per2, and Per1 loci in liver at indicated zeitgeber times. The 3′UTR of Dbp was used as a negative control (mean ± SEM, n = 4 per time point). (K) AHCY ChIP at the Dbp, Per2, and Per1 loci in liver at ZT8 and ZT20 (mean ± SEM, n = 4 per time point).
