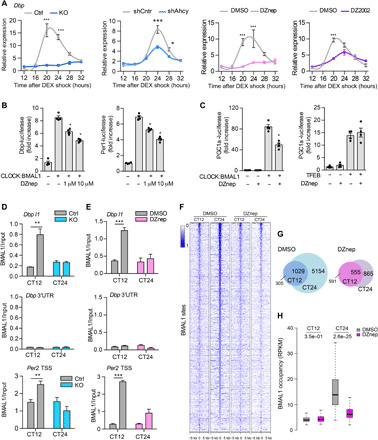
Fig. 3. AHCY regulates BMAL1 recruitment to DNA.

(A) Circadian expression of Dbp in control (Ctrl) or AHCY null (KO-2) MEFs, shCntrl and shAhcy MEFs, and MEFs treated with DMSO, 10 μM DZnep, and 100 μM DZ2002 after DEX shock (mean ± SEM, n = 3 per time point, per group; *P ≤ 0.05; **P ≤ 0.01; ***P ≤ 0.001; ANOVA, Holm-Sidak post hoc). (B) Luciferase assay of Dbp-luciferase (Dbp-luc) and Per2-luciferase (Per2-luc) in HEK293 transfected with CLOCK and BMAL1 plasmids and treated with indicated increasing doses of DZnep for 24 hours (means ± SEM, n = 4; *P ≤ 0.05; unpaired Student’s t test). (C) Luciferase assay of Pgc1a-luciferase (Pgc1a -luc) in HEK293 transfected with CLOCK and BMAL1 (left) or TFEB (right) plasmids and treated with indicated doses of DZnep for 24 hours (means ± SEM, n = 4; *P ≤ 0.05; unpaired Student’s t test). (D) BMAL1 ChIP at the Dbp and Per2 loci in control (Ctrl) or AHCY null MEFs (KO). The 3′UTR of Dbp was used as a negative control (mean ± SEM, n = 4 per time point, per group; **P ≤ 0.01; unpaired Student’s t test). (E) BMAL1 ChIP at the Dbp and Per2 loci in MEFs treated with vehicle (DMSO) or DZnep (10 μM) (mean ± SEM, n = 4 per time point, per group; ***P ≤ 0.001; unpaired Student’s t test). (F) Heatmap of BMAL1 ChIP-seq binding profiles in DMSO- and DZnep-treated MEFs at the two analyzed CT points. (G) Venn diagram of BMAL1 binding sites identified at the two analyzed CT points in vehicle (DMSO) and DZnep-treated MEFs. (H) Boxplots of number of BMAL1 tags per peak at CT12 and CT24 shared peaks in DMSO- and DZnep-treated MEFs (unpaired Student’s t test).
