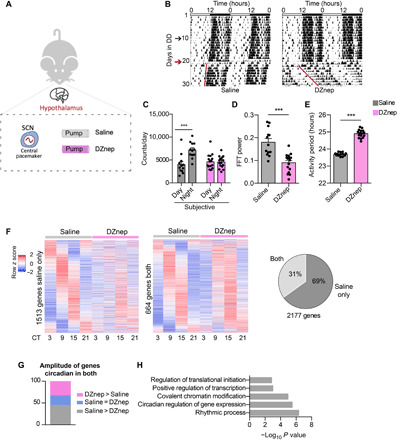
Fig. 5. In vivo inhibition of AHCY modulates circadian locomotor activity and rhythmic transcription in the SCN.

(A) Schematic of the in vivo experimental protocol. (B) Representative double-plot actograms for diurnal locomotor activity of mice infused with saline or DZnep (100 μM). In each actogram, the first days were recorded under 12-hour light/12-hour dark conditions, after which the light was turned off and recording was continued in constant darkness (DD; black arrow indicates start of DD; red arrow indicates day of surgery and starting point for all analyses). (C) Bar graph of locomotor activity during subjective night and day (mean ± SEM, n = 12 saline and n = 16 DZnep; ***P ≤ 0.001; ANOVA, Holm-Sidak post hoc). (D) Bar graph of amplitude of circadian rhythm represented by fast Fourier transform (FFT) in the circadian range (mean ± SEM, n = 12 saline and n = 16 DZnep; ***P ≤ 0.001; unpaired Student’s t test). (E) Bar graph of period lengths (mean ± SEM, n = 12 saline and n = 16 DZnep; ***P ≤ 0.001; unpaired Student’s t test). (F) Heatmaps of genes cyclic in saline-infused mice only (1513 genes) and in both conditions (saline and DZnep, 664 genes) (n = 4 per time point, per group; P < 0.05 in each dataset). Pie chart representing the percentage of genes oscillating in both conditions and in saline only. (G) Amplitude analysis of genes circadian in both conditions in the SCN. In the graph, the percentages of genes with amplitude higher, lower, or equal to saline condition are reported. (H) GO analysis of genes displaying lower amplitude in DZnep-infused mice compared to saline.
