
Fig. 3. Local KIF17 synthesis and Kif17 mRNA degradation following the activity-induced KIF17 degradation.
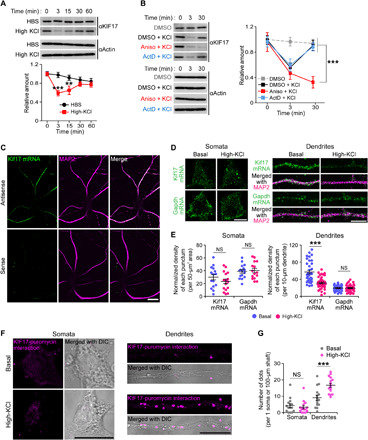
(A) Time courses of KIF17 expression after high KCl–induced stimulation. Effects of treatment (P < 0.01) and time (P < 0.001), two-way ANOVA; **P < 0.01, ***P < 0.001, Bonferroni’s post hoc comparison. n = 8 independent experiments. (B) Time courses of KIF17 expression in the stimulated hippocampal neurons treated with DMSO, anisomycin, or actinomycin D. Aniso, anisomycin; ActD, actinomycin D. Effects of treatment (P < 0.01) and time (P < 0.01) versus Aniso + KCl, two-way ANOVA; ***P < 0.001, Bonferroni’s post hoc comparison. n = 10 independent experiments. See also fig. S5A. (C) In situ hybridizations of hippocampal neurons (DIV 21) for Kif17 mRNA (green) combined with immunostaining for the dendritic shaft marker MAP2 (magenta). Scale bar, 20 μm. See also fig. S5C. (D and E) Representative images of quantitative in situ hybridization of hippocampal neurons (DIV 21 to 23) performed with the probes to detect Kif17 mRNA [top panel in (D)] and Gapdh mRNA [bottom panel in (D)] and their quantification of the normalized density of signals in somata [left panel in (E)] and dendrites [right panel in (E)]. A probe detecting Gapdh mRNA was used as a negative control. Scale bars, 10 μm. NS, P ≥ 0.05, ***P < 0.001, two-tailed t test. n = 15 to 16 somata and 34 to 44 dendrites from three independent cultures. See also fig. S5B. (F and G) Representative micrographs of the PLA between KIF17 and puromycin (F) and the quantification of the number of dots in somata and dendrites (G). The micrographs are merged with the differential interference contrast (DIC) images of DIV 21 dissociated hippocampal neurons. Scale bars, 20 μm. NS, P ≥ 0.05, ***P < 0.001, two-tailed t test. n = 15 somata and dendrites from three independent cultures.