. 2020 Dec 8;9:e62307. doi: 10.7554/eLife.62307

Figure 2. Glutaminase inhibition restores charged tRNAGln pools in amino-acid-deprived cells.

(A) Depiction of glutamine utilization pathways. (B) A method for a high-throughput profiling of tRNA charging (CHARGE-seq). (C) Mouse embryonic fibroblasts (MEFs) were treated with complete or amino-acid-free DMEM for 6 hr in presence (+) or absence (-) of 1 μM glutaminase inhibitor CB-839 and analyzed by CHARGE-seq. A representative result (out of two independent experiments) is shown. (D) MEFs were treated as in (C) and subjected to tRNA charging assay with qPCR as a readout. Data are shown as mean ± SD of N = 3 biological replicates. p-Values were calculated by one-way ANOVA with Holm-Sidak post-test. (E, F) Western blots of lysates from MEFs treated with complete or amino-acid-free DMEM for 6 hr (E), or with 100% AA (complete DMEM) or 5% AA (each amino acid supplied at a 5% of standard DMEM formulation) DMEM (F) for 24 hr, in presence (+) or absence (-) of 1 μM glutaminase inhibitor CB-839. A representative result (out of three independent experiments) is shown. See also Figure 2—figure supplement 1.

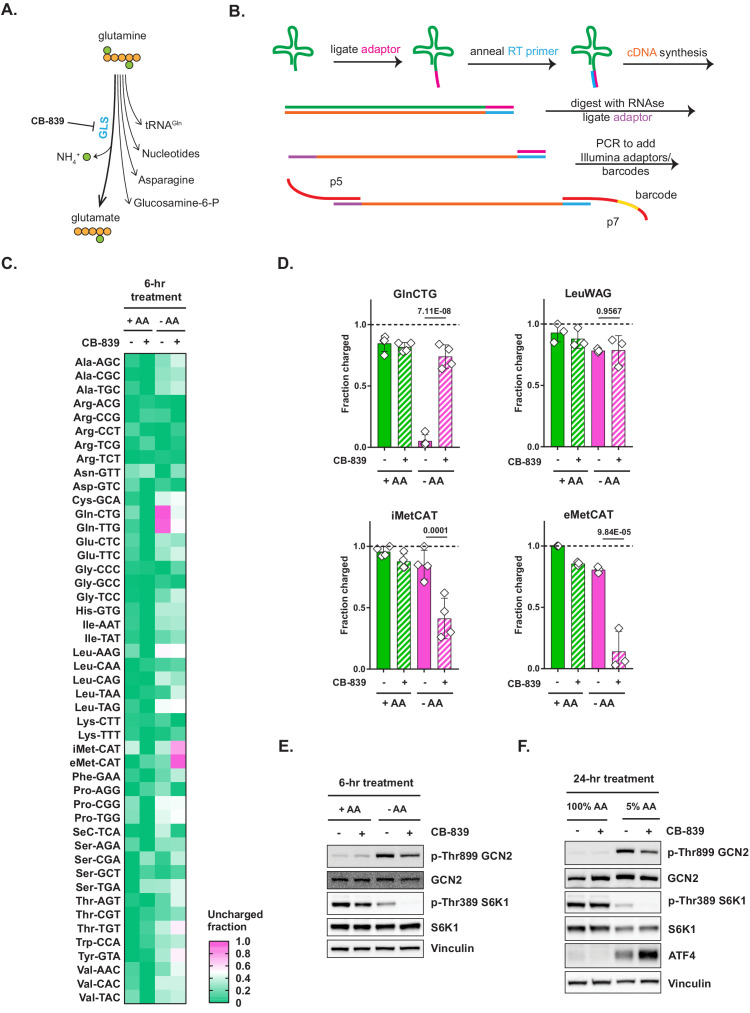
Figure 2—source data 1. Summary data and statistics for tRNA charging and cell proliferation assays presented in Figure 2 and Figure 2—figure supplement 1.

Figure 2.

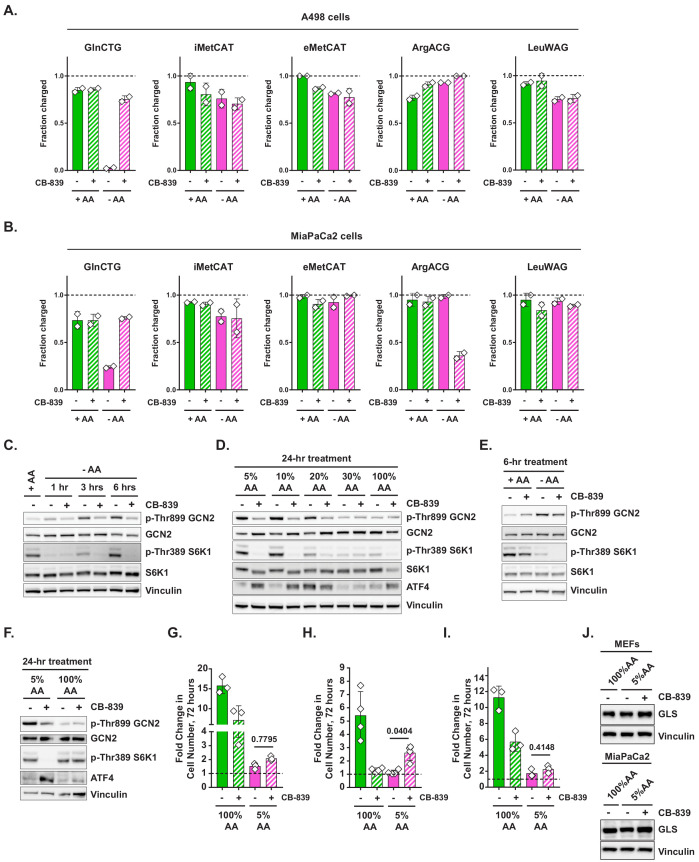
Figure 2—figure supplement 1. Loss of tRNAGln charging and its restoration via the inhibition of glutaminase across a variety of cellular contexts.

Figure 2—figure supplement 1.

(A–B) A498 (A) or MiaPaCa2 (B) cells were treated with complete or amino-acid-free DMEM for 6 hr in presence (+) or absence (-) of 1 μM glutaminase inhibitor CB-839. tRNA charging of indicated isodecoders was measured. Data are shown as mean ± SD of N = 2 biological replicates. (C) A498 cells were treated with amino-acid-free DMEM for indicated periods of time in presence (+) or absence (-) of 1 μM glutaminase inhibitor CB-839. Cell lysates were analyzed by western blotting. A representative result (out of three independent experiments) is shown. (D) A498 cells were treated with amino-acid-free DMEM supplied with varied amounts of amino acids as indicated in presence (+) or absence (-) of 1 μM glutaminase inhibitor CB-839 for 24 hr. Cell lysates were analyzed by western blotting. A representative result (out of three independent experiments) is shown. (E, F) MiaPaCa2 cells were treated with complete or amino-acid-free DMEM for 6 hr (E), or with either 100% AA or 5% AA DMEM for 24 hr (F) in the presence (+) or absence (-) of 1 μM glutaminase inhibitor CB-839. Cell lysates were analyzed by western blotting. A representative result (out of three independent experiments) is shown. (G–I) Cell proliferation in 100% AA or 5% AA DMEM in presence (+) or absence (-) of 1 μM glutaminase inhibitor CB-839 was assayed in MEFs (G), A498 (H) and MiaPaCa2 cells (I). Data are shown as mean ± SD of N = 3–4 biological replicates. p-Values were calculated by one-way ANOVA with Holm-Sidak post-test (G–I). (J) MEFs and MiaPaCa2 cells were treated for 48 hr as indicated and cell lysates were analyzed by western blotting. A representative result (out of two independent experiments) is shown.